Please see my new article in Technical Analysis of Stocks & Commodities magazine titled “New Tricks With Old Indicators” (http://traders.com/) On Sale Now.
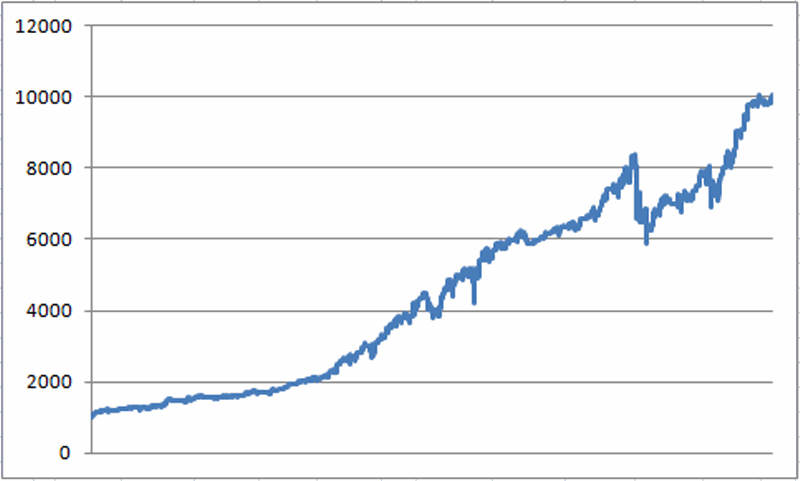
The S&P 500 has declined for three consecutive days. Should you care? Well, perhaps. In Figure 1 we see the growth of $1,000 achieved as follows:
-When the S&P 500 registers 3 (or more) consecutive lower closes, buy and hold for the next 5 trading days.
To be clear, the results shown here assume that you buy at the close of the 3rd consecutive down day and plan on holding a long position in the S&P 500 for the at least the next 5 trading days. This holding period is extended one day for each additional day the S&P declines consecutively. In other words of the S&P 500 declines for 5 consecutive days, you would buy at the close of the 3rd consecutive down day and hold for 7 trading days.
Not sure of that explanation helped or made things more confusing but there you have it.  Figure 1 – Growth of $1,000 invested in S&P 500 after 3 (or more) consecutive down closes (December 1987 to present)
In this test, an initial $1,000 grew to $9,869, or +887% (no slippage, commissions, taxes, dividends, interest, etc., just raw price return), with a maximum drawdown of -19.3%.
Filtering for Trend
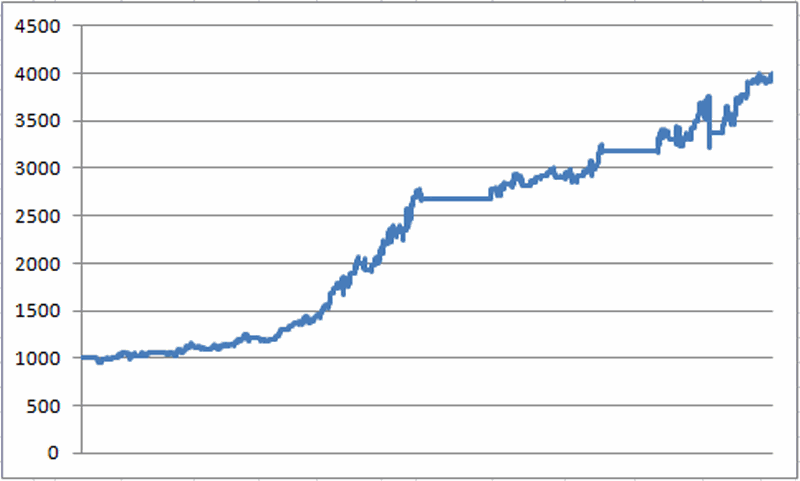
One of the dangers of this approach is the “Are You Sure You Want to Try to Catch that Falling Safe?” conundrum. So what happens if we only take the trades that occur when the S&P 500 is in an established uptrend? If we only take the trades that occur when the S&P 500 is above its 250-day moving average we get some Bad News and some Good News.
The Bad News is that $1,000 grows to $3,935, or +293%. So clearly a lot of profit potential left on the table.
The Good News is that the maximum drawdown using this method is only a very manageable -9.8%.  Figure 2 – Growth of $1,000 invested in S&P 500 after 3 (or more) consecutive down closes (December 1987 to present) only when S&P 500 is ABOVE its 250-day moving average
Using Leverage
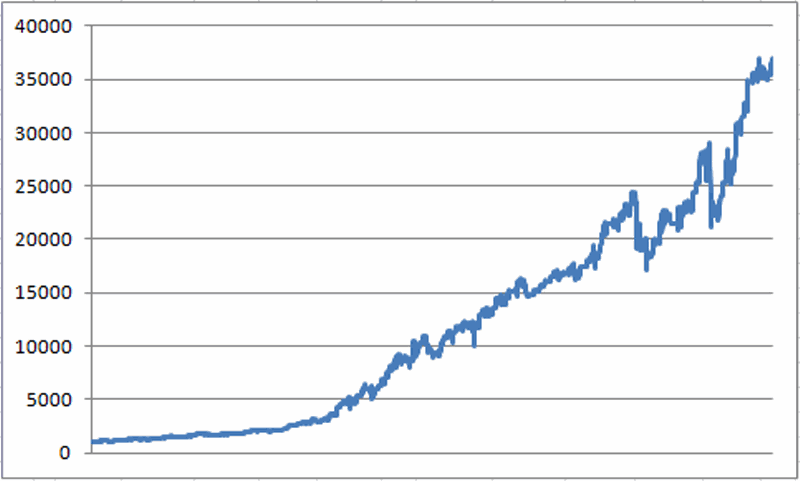
Figure 3 displays the growth of $1,000 using the following assumptions:
-If the S&P 500 declines 3 or more consecutive days AND the S&P 500 is BELOW its 200-day moving average, buy and hold the S&P 500 index for 5 trading days
-If the S&P 500 declines 3 or more consecutive days AND the S&P 500 is ABOVE its 250-day moving average, buy and hold the S&P 500 index using leverage of 2-to-1 (via a leveraged ETF or mutual fund) for 5 trading days
-For this test we assume that an annualized rate of 1% interest is earned when no position is held.
In a nutshell, if the stock market is in an objectively identified up trend (i.e., close above 200-day moving average) we will attempt to press our advantage by using 2-to-1 leverage. When the S&P 500 is below its 250-day moving average we will eschew the use of leverage.
The results for this test appear in Figure 3.  Figure 3 – Growth of $1,000 invested in S&P 500 after 3 (or more) consecutive down closes using 2-to-1 leverage if S&P 500 > 250-day moving average (December 1987 to present)
Using this approach $1,000 grew to $35,868, or +3,469% (albeit with a maximum drawdown of -20.2%).
Funds to Use
Mutual Fund: Profunds ticker BLPIX (S&P x 1)
Mutual Fund: Profunds ticker ULPIX (S&P x 2)
ETF: Ticker SPY (S&P 500 x 1)
ETF: Ticker SSO (S&P 500 x 2)
Summary
Does this simple method represent the “Holy Grail of Trading?” Of course not. Is it even better than whatever system you are using right now? I can’t answer that, only you can. But the main point here is simply to note that dips in the stock market – even in the face of an overall downtrend – tend to be buying opportunities (at least in the short run).
The simple rules presented here represent just one way to exploit this fact.
Jay Kaeppel

