The trading days around holidays have a long-term tendency to be bullish for the stock market. While I typically stick to the “3 trading days before and 3 trading days after” a holiday as “the bullish period”, with Thanksgiving it might make sense to cut things a little finer.
The Big 3 Turkey Days
The best time around Thanksgiving has tended to be the two trading days before (Tuesday and Wednesday) and the day after (Friday). The good news is that period has been consistently bullish over time. The “bad news” is that it appears to have been slightly less effective in recent years.
For our purposes we will measure the price change for the Dow Jones Industrial Average from the close on Monday the week of Thanksgiving and the close on Friday of the same week.
Figure 1 displays the cumulative % growth.

Figure 1 – Cumulative Dow % +(-) 2 days before and 1 day after Thanksgiving; 1950-2019
The cumulative growth from 1950 through 2019 was +68.0%. If that doesn’t seem like much just remember that we are talking about just 3 trading days a year.
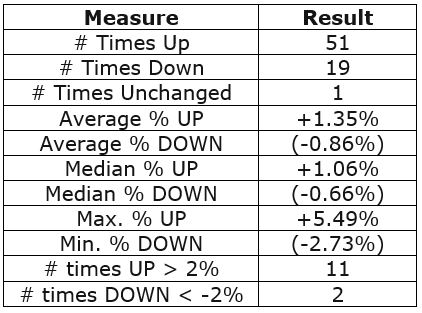
Figure 2 displays some of the relevant facts and figures

Figure 2 – Relevant Facts and Figures
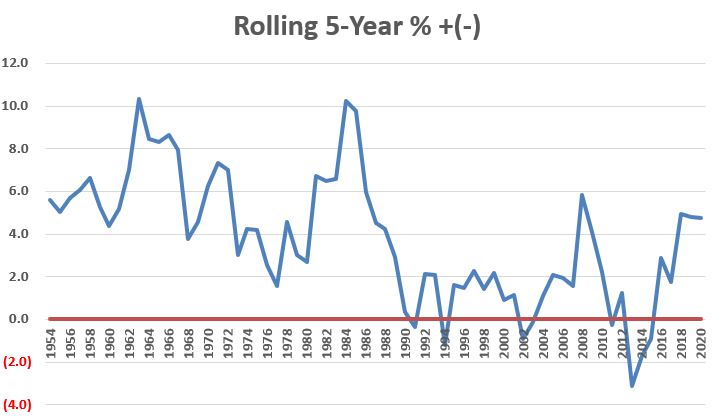
Figure 3 displays the rolling 5-year return and Figure 4 displays the rolling 10-year return. For what it is worth, returns have come down in recent years. This may be due to more people being aware of these types of seasonal trends (thanks to blabbermouths like yours truly?).

Figure 3 – Rolling 5-year returns

Figure 4 – Rolling 10-year returns
Figure 5 below displays the year-by-year 3-day results for the Dow.
| Year | 3 “Turkey” Day Dow % +(-) |
| 1950 | 1.7 |
| 1951 | (1.1) |
| 1952 | 0.9 |
| 1953 | 1.7 |
| 1954 | 2.2 |
| 1955 | 1.2 |
| 1956 | (0.4) |
| 1957 | 1.2 |
| 1958 | 2.3 |
| 1959 | 0.9 |
| 1960 | 0.3 |
| 1961 | 0.3 |
| 1962 | 3.0 |
| 1963 | 5.5 |
| 1964 | (0.8) |
| 1965 | 0.2 |
| 1966 | 0.6 |
| 1967 | 2.3 |
| 1968 | 1.4 |
| 1969 | (0.1) |
| 1970 | 1.8 |
| 1971 | 1.7 |
| 1972 | 2.0 |
| 1973 | (2.4) |
| 1974 | 1.1 |
| 1975 | 1.8 |
| 1976 | 0.1 |
| 1977 | 1.0 |
| 1978 | 0.6 |
| 1979 | (0.4) |
| 1980 | 1.5 |
| 1981 | 4.0 |
| 1982 | 0.7 |
| 1983 | 0.7 |
| 1984 | 3.0 |
| 1985 | 1.1 |
| 1986 | 0.4 |
| 1987 | (0.7) |
| 1988 | 0.4 |
| 1989 | 1.7 |
| 1990 | (1.5) |
| 1991 | (0.3) |
| 1992 | 1.8 |
| 1993 | 0.4 |
| 1994 | (1.6) |
| 1995 | 1.3 |
| 1996 | (0.4) |
| 1997 | 2.6 |
| 1998 | (0.4) |
| 1999 | (0.9) |
| 2000 | 0.1 |
| 2001 | (0.2) |
| 2002 | 0.5 |
| 2003 | 0.4 |
| 2004 | 0.3 |
| 2005 | 1.0 |
| 2006 | (0.3) |
| 2007 | 0.2 |
| 2008 | 4.6 |
| 2009 | (1.3) |
| 2010 | (0.8) |
| 2011 | (2.7) |
| 2012 | 1.7 |
| 2013 | 0.1 |
| 2014 | 0.1 |
| 2015 | 0.0 |
| 2016 | 1.0 |
| 2017 | 0.5 |
| 2018 | 3.2 |
| 2019 | (0.1) |
| 2020 | ? |
Figure 5 – Year-by-year results
Happy Thanksgiving!
See also Jay Kaeppel Interview in July 2020 issue of Technical Analysis of Stocks and Commodities magazine
See also Jay’s “A Strategy You Probably Haven’t Considered” Video
See also Video – The Long-Term…Now More Important Than Ever
Jay Kaeppel
Disclaimer: The information, opinions and ideas expressed herein are for informational and educational purposes only and are based on research conducted and presented solely by the author. The information presented represents the views of the author only and does not constitute a complete description of any investment service. In addition, nothing presented herein should be construed as investment advice, as an advertisement or offering of investment advisory services, or as an offer to sell or a solicitation to buy any security. The data presented herein were obtained from various third-party sources. While the data is believed to be reliable, no representation is made as to, and no responsibility, warranty or liability is accepted for the accuracy or completeness of such information. International investments are subject to additional risks such as currency fluctuations, political instability and the potential for illiquid markets. Past performance is no guarantee of future results. There is risk of loss in all trading. Back tested performance does not represent actual performance and should not be interpreted as an indication of such performance. Also, back tested performance results have certain inherent limitations and differs from actual performance because it is achieved with the benefit of hindsight.

