In this article I detailed a fairly simple model for deciding whether to favor stocks or gold (at least with a portion of one’s investment capital). This model will turn bullish for gold (though not necessarily bearish for stocks) at the end of January. First a quick recap. The model as presented in the original article:
*tracks the cumulative performance for gold and SPX using monthly total return data from the PEP database by Callan Associates for gold bullion and the S&P 500 Index (although just using price data would likely produce about the same results)
*tracks the ratio of SPX performance relative to gold performance
*tracks a 21-month exponential moving average of the relationship between the two
*When the ratio is above the moving average the model favors stocks and when the ratio is below the moving average the model favors gold (FYI, I use a 1-month lag. So if a signal occurs at the end of March then the actual trade takes place at the end of April)
Simple enough.
For the record, I have made two changes since the original article:
*I now use a 22-month exponential moving average (instead of 21)
*Instead of using a cutoff of 0.00 (i.e., long SPX if > 0 or long gold if <= 0) I use a cutoff of -0.1 (i.e., long SPX if >-0.1 or long gold if <= -0.1).
Go ahead and accuse of me of curve-fitting, I am probably guilty as charged. But for the record, the tweaks caused cumulative hypothetical profits to jump by a factor of 1.53-to-1. So, I’ve decided to take my chances with the new rules as follows:
Jay’s SPX/Gold Ratio Indicator
A = monthly total return for SPX
B = monthly return for gold bullion
C = Growth of $1,000 invested in SPX
D = Growth of $1,000 invested in Gold
E = C / D (i.e., our SPX/Gold Ratio)
F = 22-month exponential moving average of E
If F > -0.1 then hold SPX
IF F<= -0.1 then hold gold
Figure 1 displays the SPX/Gold Ratio and the 22-month EMA.
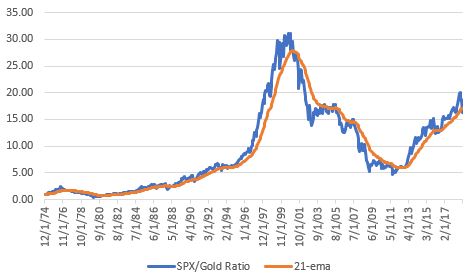
Figure 1 – Model’s SPX/Gold Ratio and the 22-month EMA
The (Updated) Results
Note at the far right of Figure 1 that the ratio dropped below the 22-month EMA (by more than the requisite amount of -0.1) at the end of December 2018. This means that a signal has been generated and that this particular system will exit SPY and buy GLD at the end of January 2019.
Using the method just described, Figure 2 displays the following:
*The blue line represents the growth of $1,000 invested in SPX when the model favors stocks and in gold bullion when the model favors gold.
*The orange line represents the growth of $1,000 split 50/50 between SPX and gold bullion and rebalanced to a 50/50 split at the end of each calendar year
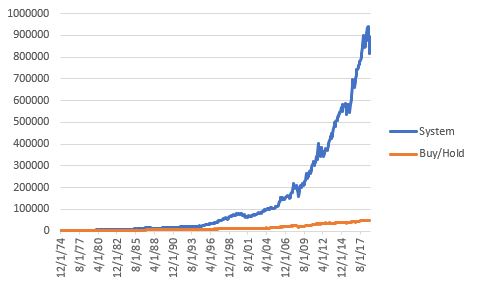
Figure 2 – Growth of $1,000 invested by switching between gold and the S&P 500 Index using the model rules (blue) versus splitting 50/50 and rebalancing each year (orange)
Figure 3 displays the growth of $1,000 invested in SPX when the model favors stocks (blue line) versus $1,000 invested in SPX when the model favors gold.
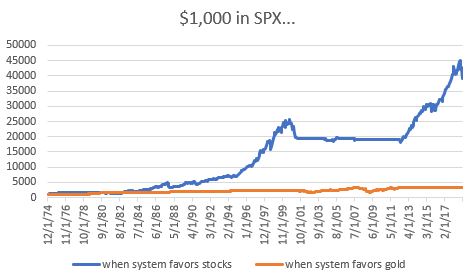
Figure 3 – SPX performance when model is bullish for stocks (blue) versus SPX performance when model is bullish for gold (orange)
Figure 4 displays the growth of $1,000 invested in gold when the model favors stocks (blue line) versus $1,000 invested in gold when the model favors gold.
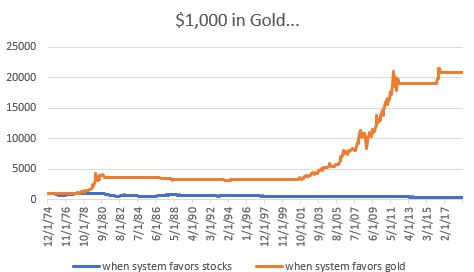
Figure 4 – Gold performance when model is bullish for gold (blue) versus gold performance when model is bullish for SPX (orange)
Figure 5 displays the cumulative results of holding either SPX or gold depending on the status of the model.
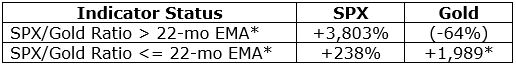
Figure 5
The Latest
As mentioned above, this particular “system” will switch to gold at the end of January 2019. Figure 6 displays the price action for ticker GLD, an ETF designed to track the price of gold bullion. Note that price is over 20% above its late 2015 low and has rallied recently. However, there is some significant resistance above.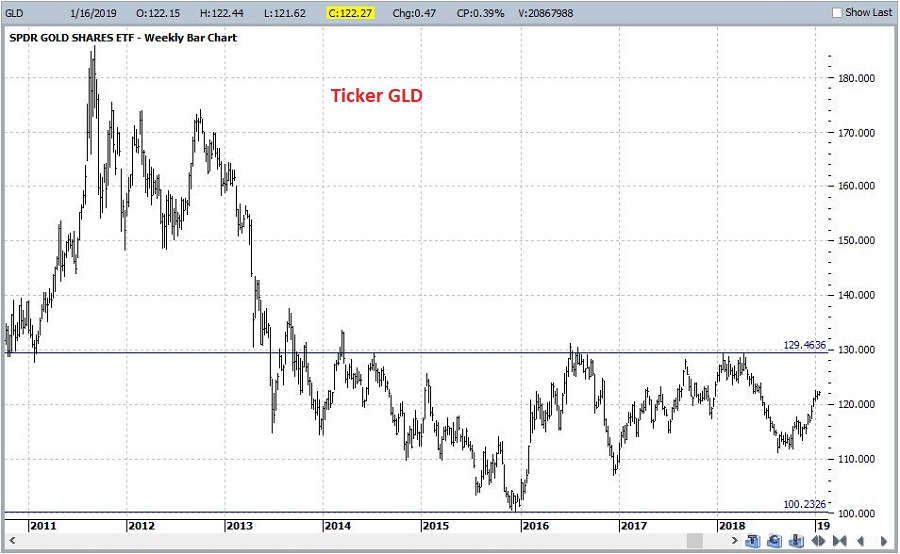 Figure 6 – Ticker GLD with support and resistance (Courtesy ProfitSource by HUBB)
Summary
As always, I don’t make “recommendations.” So, please do not take this as me urging you to pile into gold on January 31st. The purpose of this article is merely to point out that this particular system has generated a switch signal out of stocks and into gold to be executed at the end of January. Does this mean that gold is sure to rally? Does it mean that the end of the bull market is nigh for stocks?
In reality the answers to these questions are, “No” and “not necessarily”. All it really means is that a system that has done a decent job in the past of timing switches between stocks and gold has generated a new signal.
Only time will tell if this latest signal is useful or not.
Jay Kaeppel
Disclaimer: The data presented herein were obtained from various third-party sources. While I believe the data to be reliable, no representation is made as to, and no responsibility, warranty or liability is accepted for the accuracy or completeness of such information. The information, opinions and ideas expressed herein are for informational and educational purposes only and do not constitute and should not be construed as investment advice, an advertisement or offering of investment advisory services, or an offer to sell or a solicitation to buy any security.


JAY: Could you please explain what growth of $1000 invested in SPX or Gold mean. My ratio of growth of $1000 invested in SPX and Gold always hover around 1, not as high as your nos. Little confused. Thanks for clarifying.
Let me give it a shot. If $1000 is invested in SPX fund say on Nov 1st and on Dec 1st it’s value is $1010, then growth for Nov is $10(1%).
A similar $1000 investment is done in Gold fund and say the growth is $5(0.5%) for Dec. The ratio is $10/$5 = 2.
This growth calculation of investing $1000 in both SPX and Gold is done for each month to compute the ratio.
Jay, is the ratio calculated using growth in $ or %? Can you please suggest any free online resources that does these calculations and plot these ratios and moving averages ? Thanks always for your posts.
Sorry, should have made that a little simpler and more obvious. What I have is monthly total return data for S&P GSCI Gold Spot Price Index and the S&P 500 Index starting with January 1975. So I started with $1,000 in SPX and $1,000 in gold and just tracked the cumulative value. So at first the ratio was 1-to-1. By then end of 12/31/2019, SPX grew to $117,194 and gold to $7,207, so now the SPX/Gold Ratio as I track it is 16.26. But remember I also use a 22-month EMA and the measurement is the current ratio versus the EMA. So my guess is that simply using closing price data would (obviously) result in different ratio but the relationship between ratio and EMA of ratio would likely generate the same results. Sorry, but I haven’t done this with price data. Jay
Thank you for direction. Are any sense to use 3x Gold Bull / 3x SPX ETF for more fun in this system? 🙂 If so which one?