“Intermarket Analysis” was a phrase first popularized by the legendary investor and author John Murphy. Turns out he was on to something. To give you the idea, in this piece we will look at the interplay between the S&P 500 Index and the price of gold.
The correlation of monthly returns between SPX and Gold since 1975 is a measly 0.0132. To put if another way, there is no positive or negative correlation whatsoever between these two markets. The fundamentals that drive the prices of these two “assets” are completely different.
The SPX/Gold Ratio Indicator
A = monthly total return for SPX
B = monthly return for gold bullion
C = Growth of $1,000 invested in SPX
D = Growth of $1,000 invested in Gold
E = C / D (i.e., our SPX/Gold Ratio)
F = 21-month exponential moving average of E
Figure 1 displays the SPX/Gold Ratio and the 21-month EMA (Variables E and F above). In a nutshell, when the lines are rising it means stocks are outperforming and when the lines are falling it means gold is outperforming.
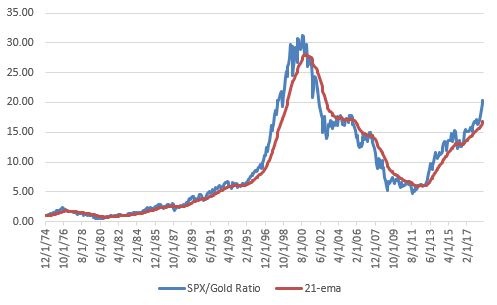
Figure 1 – SPX/Gold Ratio (blue) versus 21-month EMA (red); 12/31/1974-9/30-2018
Interpretation is simple:
*If the blue line is above the red line hold SPX (call this “Bullish”)
*If the blue line is below the red line hold Gold (call this “Bearish”)
*For my own purposes I use a 1-month lag (i.e., if the blue line crosses above the red line after the close of trading in January, buy SPX at the close of trading in February. If the blue line crosses below the red line at the end of March, buy Gold at the close of trading in April.)
Performance
Figure 2 displays the performance of buying and holding SPX when the indicator is bullish versus bearish.
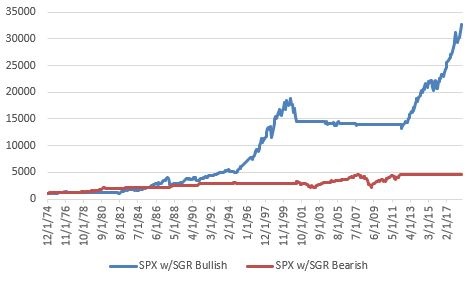
Figure 2 – Growth of $1,000 invested in SPX when SGR is Bullish (blue) versus when SGR is Bearish (red); 12/31/1974-9/30/2018
As you can see, stock market is overall pretty good when the SGR is bullish.
Figure 3 displays the growth of $1,000 invested in gold bullion when the SGR is “Bearish” (i.e., favors gold).
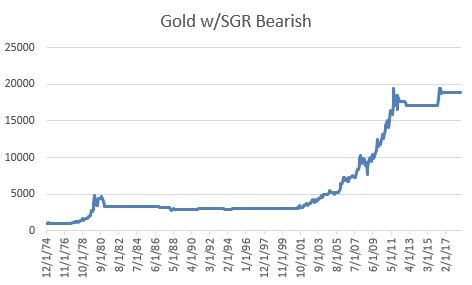
Figure 3 – Growth of $1,000 invested in Gold when SGR is Bearish; 12/31/1974-9/30/2018
Figure 4 displays the growth of $1,000 invested in gold bullion when the SGR is “Bullish” (i.e., favors SPX).
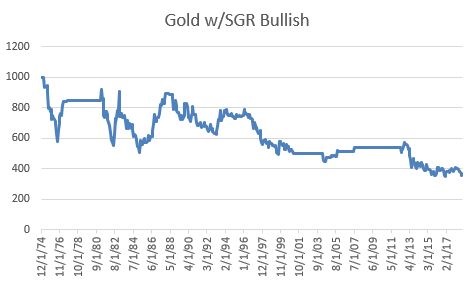
Figure 4 – Growth of $1,000 invested in Gold when SGR is Bullish; 12/31/1974-9/30/2018
Results from 12/31/1974 through 9/30/2018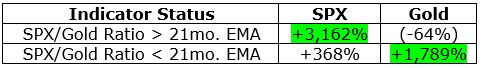
So clearly there appears to be an advantage to switching when the ratio changes from Bullish to Bearish and vice versa.
“System” Results
The rules are simple:
*When the SGR rises above the 21ema (wait one month) then buy SPX
*When the SGR falls below the 21ema (wait one month) then buy Gold
*For our benchmark, we will assume that money is split evenly between SPX and Gold on December 31st of each year.
The results appear in Figure 5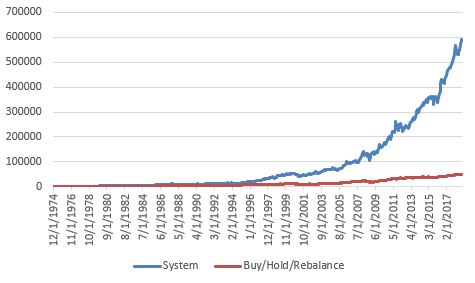
Figure 5 – Growth of $1,000 invested using “System” (blue) versus “Buy/Hold/Rebalance” (red); 12/31/1974-9/3/2018
For the record:
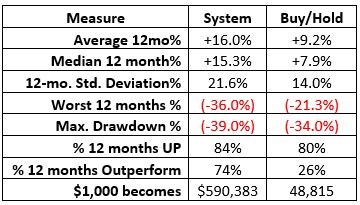
Figure 6 – Performance Results; System versus Buy/Hold/Rebalance
The Good News regarding the System:
*It made a lot more money than buy-and-hold
*It was profitable over 12 months 84% of the time
*It outperformed buy-and-hold 74% of the time
The Bad News regarding the System:
*It was much more volatile than buy and hold (21% average 12-month standard deviation versus 14% for buy-and-hold)
*It had larger drawdowns than buy-and-hold (Worst 12-month return = -36%, worst Maximum Drawdown = -39%)
Summary
Our SPX/Gold Ratio System made 12 times as much money as buy-and-hold (and rebalance annually) over almost a 44-year period. Yet, it did so in a very volatile manner. The real question is “can an investor” stick with it through the large drawdowns long enough to enjoy the benefits?”
That’s a question each investor needs to answer for themselves.
Jay Kaeppel
Disclaimer: The data presented herein were obtained from various third-party sources. While I believe the data to be reliable, no representation is made as to, and no responsibility, warranty or liability is accepted for the accuracy or completeness of such information. The information, opinions and ideas expressed herein are for informational and educational purposes only and do not constitute and should not be construed as investment advice, an advertisement or offering of investment advisory services, or an offer to sell or a solicitation to buy any security.

