In Part I here I laid out my main thoughts regarding the bond market. The final point mentioned that two trading models for bonds that I follow are presently bullish. So in Part II let’s bring those up-to-date.
#1. Japanese Stocks (EWJ) vs. Long-Term Treasuries (TLT)
I have written about this model on several occasions in the past (here, here and here). But in a nutshell:
*The Japanese stock market (using ETF ticker EWJ as a proxy) and long-term U.S. treasury bonds (using ETF ticker TLT as a proxy) tend to have an inverse relationship over time.
Therefore:
*A bearish trend for EWJ (5-week moving average below 30-week moving average) tends to be bullish for bonds.
*A bullish trend for EWJ (5-week moving average above 30-week moving average) tends to be bearish for bonds.
Figure 1 displays the EWJ on top with TLT on the bottom. Note the general inverse correlation in price movement.
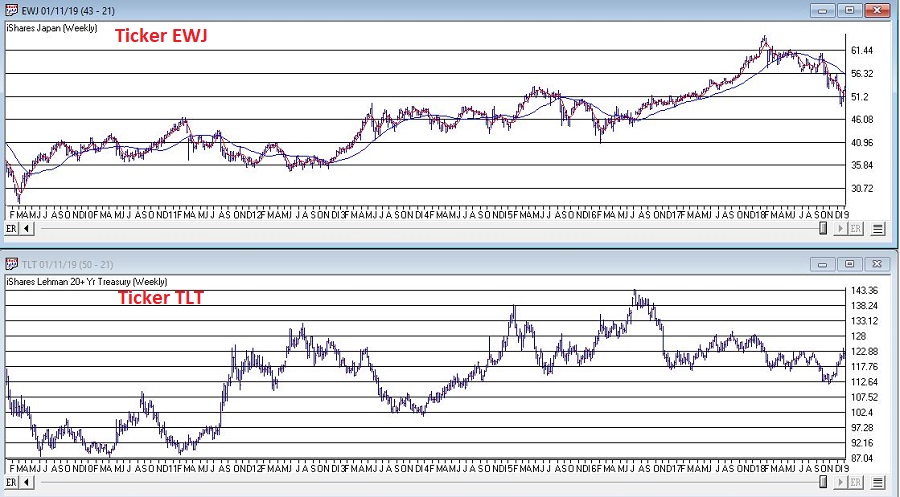 Figure 1 – T-Bonds (ticker TLT in bottom clip) tend to move inversely to Japanese stocks (ticker EWJ with 5-weel and 30-week moving averages in top clip) (Courtesy AIQ TradingExpert)
#2. Gold/Copper Ratio versus Bonds
I have written about this before here. In a nutshell:
*The gold/copper ratio has a relatively high correlation to the price of t-bonds (current correlation coefficient = 0.73; a reading of 1.00 means they mirror each other, a reading of -1 means there are trade exactly inversely).
Figure 2 displays treasury bond futures prices (blue) versus the Gold/Copper Ratio (x10) since 2001. The correlation is fairly obvious to the naked eye.
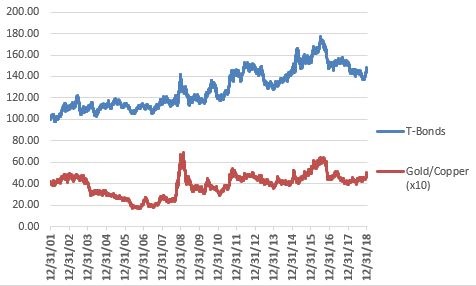
Figure 2 – T-bond futures price (blue) versus Gold/Copper ratio (x10); 12/31/01-1/11/2019
*When the gold/copper ratio is in an uptrend (see here for how that designation is made) this indicator is considered bullish for bonds
*When the gold/copper ratio is in a downtrend this indicator is considered bearish for bonds
Putting the Two Together
*If either of the models is bullish that is considered bullish for bonds
*If both models are bearish that is considered very bearish for bonds
Figure 3 displays the gain or loss from holding a long position in a treasury bond futures contract depending on whether, a) neither model is bullish (red), or, b) one or more of the models is bullish (blue)
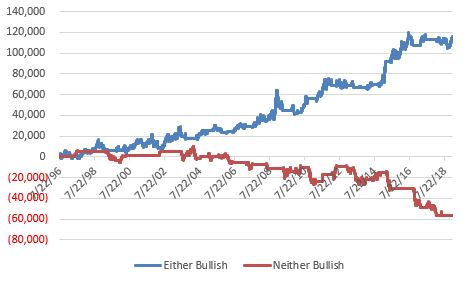
Figure 3 – Cumulative $ gain (loss) from holding long t-bond futures if 1 or more model is bullish (blue) versus if neither model is bullish (red); 7/22/96-1/11/19
As you can see, a bullish reading in no way guarantees higher bond price and a bearish reading in no way guarantees lower bond price. Still, given the stark differences between the performance of the blue line and the red line, that would seem to be the way to bet.
For what it is worth, both models detailed above are bullish at the moment.
Summary
*In Part I, I basically inferred a preference for short to intermediate term bonds for people who buy and hold bonds (or bond funds) as part of a longer-term investment strategy (if rates rise 1 percentage point, a 30-year bond paying 4% a year, will lose -15% in principal – too much risk from my perspective).
*At the same time, as highlighted here in Part II, long-term bonds can still offer outstanding trading opportunities both on the long side and the short side – for those inclined to play.
Jay Kaeppel
Disclaimer: The data presented herein were obtained from various third-party sources. While I believe the data to be reliable, no representation is made as to, and no responsibility, warranty or liability is accepted for the accuracy or completeness of such information. The information, opinions and ideas expressed herein are for informational and educational purposes only and do not constitute and should not be construed as investment advice, an advertisement or offering of investment advisory services, or an offer to sell or a solicitation to buy any security.

