The Importance of Respecting the Trend

The trend is your friend. OK, you’ve probably heard that before.  But there is a good reason that this phrase is heard so commonly among traders.

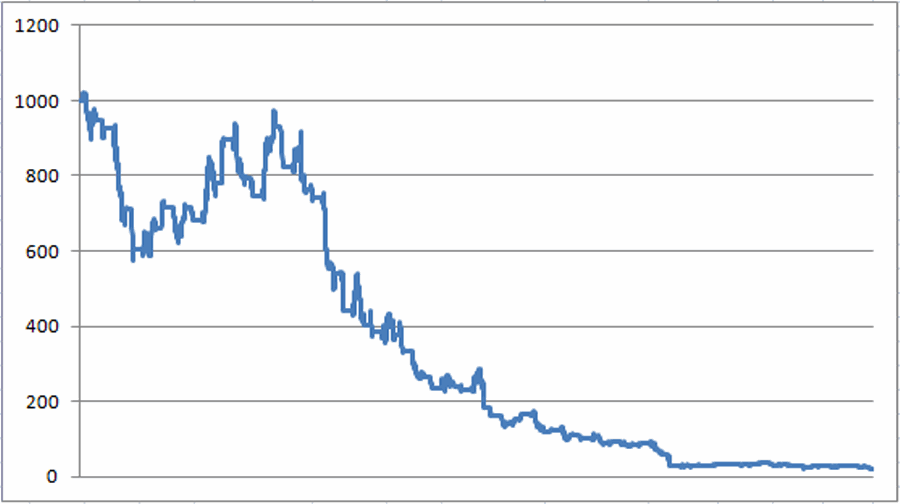
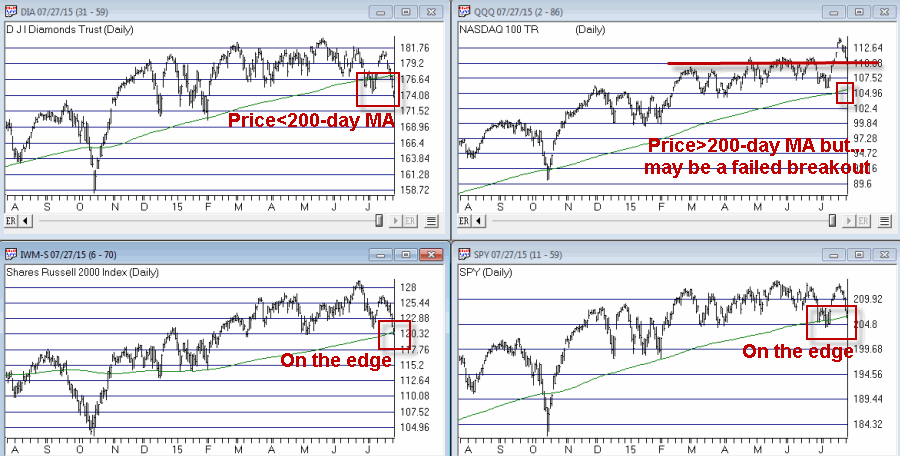
For those who were willing to hear what the market was saying, there was some advance warning that trouble was brewing.  A glance at Figure 1 shows us that the major market measures – the Dow, the S&P 500 Index, the Russell 2000 small-cap index and the Vanguard Total World Stock Index ETF – were all breaking down below their respective 200-day moving averages prior to “the Plunge”.

1
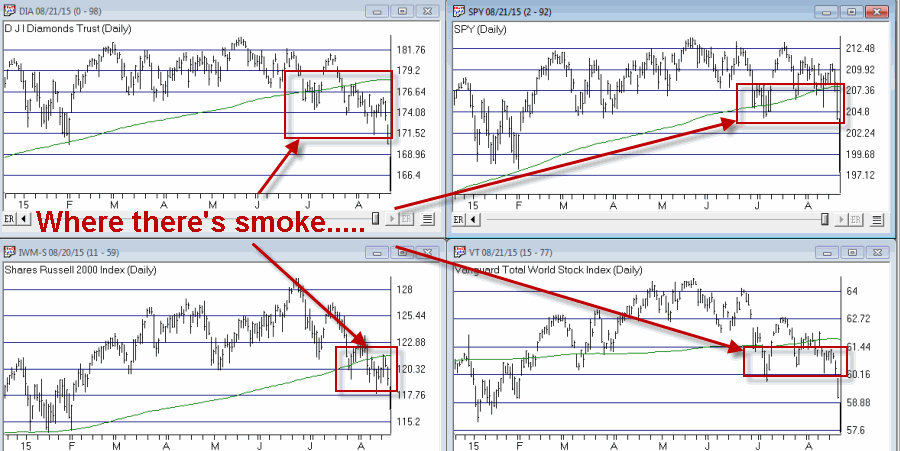
Figure 1 – Stock Market Indexes signaling “trouble” prior to the “Plunge”

See also This is Why We Trade

OK, for the record I am not an “investment advisor”, on this blog I do not make “recommendations” and I never – OK, rarely – try to make “predictions” (because quite frankly, who needs the humiliation).

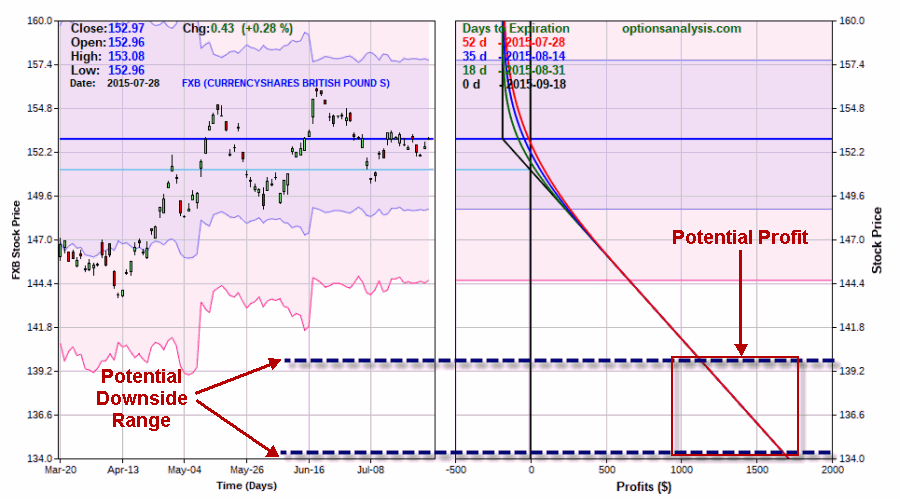
I do know something about following a trend, however, and for the record I did issue something of a warning (OK, more like a veiled threat) in this article on July 28th.

Also, on 8/11 the Dow Industrials experienced what is widely known as the “Death Cross” – which occurs when the 50-day moving average drops below the 200-day moving average.  Now I also (mostly) try to avoid casting stones at other financial writers (glass houses and what not).  So as a result, I did not write the article about how it concerned me a great deal that within 48 hours of the Dow “Death Cross” I came across roughly 352 articles telling me that the “Death Cross” doesn’t mean a thing because “sometimes it works and sometimes it doesn’t”.

Now here is the important point:

All roughly 352 authors were technically correct that sometimes the Death Cross “works” (i.e., prices head significantly lower) and sometimes it does not.  But the fact of the matter is – at least in my opinion – that the trend must be respected at all times.  No one likes to get whipsawed, and no you do not have to “sell everything”, every time a stock index drops below its 200-day moving average.  BUT, when lots of indexes start breaking down at the same time the one thing you cannot do is simply DISMISS IT!!

As I mentioned, a Death Cross or a drop below a particular moving average does not have to mean “sell everything.”  But it should mean “protect yourself just in case.”  That might mean raising some cash or hedging with options, etc.

What Should I Do Now?

That seems to be the question everyone asks after a market plunge.  That and “Where does the market go from here”.  Now as a “financial analyst type” I know that people or sort of trained to expect that the next thing I will do is discuss where I think the market is headed from here and what you should do now.  But, like I said, I don’t “do predictions”.  So for the moment I won’t bother telling you where I think the market is headed next.  But I think I can answer the “What Should I Do Now” question.

Jay’s Trading Maxim #29: If you had a trading plan that you were following yesterday, you should continue following it today.

Now I admit that may sound a bit snarky but it is not intended to. For if your approach to trading is to do one thing, and then when trouble arises you start to do something else, then – let’s face it – you don’t really have much of a plan.

For what it is worth, I will say that I am OK with “buy and hold” with a portion of a portfolio.  I have some mutual funds that I think I have held for what could be close to 30 years.  I’ll sell those when I need the money.  But not before.

But I am not a fan of “only buy-and-hold”.  An investor who puts all of his or her money in the stock market and leaves it there is (in my opinion) like a ship at sea without a rudder.  When the winds are favorable things will go really well.  When a storm arises some very, very bad things can happen and you have absolutely no control (except to hold on tight and hope the storm passes while you are still afloat).

So for what it is worth, ponder the “approach” listed below:

*40% in the stock and/or bond markets on a buy-and-hold basis

*30% in objective trading or investment strategies that can outperform over time (see some other articles on this site for some ideas. Another site to peruse for examples of objective strategies is wwwQuantocracy.com)

*20% in short-term trading strategies (can go cash and ply the short side, and may include options trading)

*10% in cash or hedging positions

Nothing magic about this formula.  But this type of diversified approach allows an investor to attack the financial markets from a variety of angles.

Which looks like a pretty good idea right about now.

Jay Kaeppel


This is Why We Trade

This is why we trade.

When the world goes to heck in a hand basket and seemingly cataclysmic events swirl around us completely out of our control, we remain the “captain of our own ship.”  The value of our house may decline. The business that supports our livelihood may suffer anywhere from minimal to major damage. Our 401K may start to look like a 201K. Politicians on all sides blather on attempting to assess blame as far away from them as possible. Talk of the next Great Depression may become more common. Yes, the perception may be that it is all imploding down around us.

This is why we trade.

Not because it’s cool or fun, or an interesting hobby. Not because we have all of these fast computer and lots of data and an endless array of tools and techniques to work with. Not because we enjoy exchanging ideas with other individuals regarding the latest and greatest methods and techniques. Not because we enjoy telling our friends about or latest conquest in the markets or draw comfort from commiserating with others regarding our most recent losing trade.

We trade because trading is the only business that allows us the opportunity to make money regardless of the events that go on around us. Granted we must be on the right side of those events – or at least not be on the wrong side for very long – in order to prosper. But that is a given. Unlike true gambling related endeavors, if we make a bad bet, we can with as much haste as possible, pull our bet off the table and wait for a better opportunity.

Many who consider themselves to be “red-blooded Americans” have an aversion to selling short. Too much risk, too much uncertainty, and doggone it we like it when things go up not down. And in a perfect world that would be great. If you dare take your hands from over your eyes and survey the current state of affairs the odds are good that you will conclude that this is presently not a perfect world.

But you see, this is why we trade.

When those things around us are good we can take a long position and

prosper. When those things around us head south we can sell short and do the same. Wait a minute. Doesn’t that make us “evil speculators?”  Not by any sane definition. By any sane definition we are simply people who prefer to shape our own destinies rather than rely on others to do it for us. We are simply people who when faced with adversity would prefer to take responsibility rather than sit around and whine and complain that no one is bailing us out. People who trade are the true capitalists. And while some seem to be taking great glee in disparaging capitalism these days, the fact is that those people are fools.

Freedom – not only freedom to live as you choose but to make your own way in the world – is the single greatest “entitlement.” Slowly but surely this right seems to be slipping from our grasp. More and more the “powers that be” attempt to assert greater control over the everyday lives of others.  And I am talking about politicians from both sides of the political spectrum.  This more than anything explains the great unraveling that we are witnessing today. And we also must recognize our own culpability in all of this. Perhaps if we had looked up more often from our big screen TV’s and laptops and iPhones, we would not be where we are.  But we are.

Which of course, is just one more reason why we trade.

Somewhere in the past two decades too many people came to the conclusion that because we now have high technology that we are somehow impervious to the economic cycle. So let me be the first to say, “Welcome back to reality.”

Still, this is why we trade.

Unless and until they close down the exchanges and simply have government set the price for everything, we have the opportunity to continue to live a decent lifestyle. Until the income tax approaches 100% (somewhere, some politician just read this and thought, “Why didn’t I think of that?”), we can take steps to continue to make money as other avenues dwindle. No politician is going to solve the current state of affairs. Only “the people” can do that. And this week some of those people actually stirred from their slumber.

The “Current Crisis” versus “Past Crises”

How this current market decline will work out in the end is a subject of great debate.  I will spare you my “prediction”.  I do so simply because if I lined up all of the predictions I have made over the years as well as all of the predictions that I have heard others make over the years it would start to look a lot like those endless miles of government red ink.

And this too, is why we trade.

By not being fully locked into the “buy and hold” mentality we retain the flexibility to take advantage of new opportunities as they arrive and to cut our risk significantly when things get too volatile and unstable.  And if we trade with an eye towards minimizing risk, we find ourselves losing only a small amount even when we are spectacularly wrong in our market opinions.

Which – oddly, is a good thing.

Which is just one more reason why we trade.

Summary

Contrary to what you might expect me to say at this point, I believe that there is absolutely nothing wrong with investing a portion of your money using a long-term buy and hold approach.  If for example, you want to put a portion of your income into a mutual fund or ETF and let it ride for the long-term, by all means go ahead.  But also remember that if you do so with all of your money then your portfolio is essentially like a ship at sea without a rudder.  As long as the wind and tides move in a favorable direction you may eventually reach your destination.  But the fact remains that you are trusting outside forces to control your own destiny.

By taking the time to develop and/or learn a small handful of trading techniques, entry and exit techniques, position sizing, money management and risk control, you afford yourself the potential to stand at the wheel as the captain of your own ship charting your own course in even the most turbulent waters.

As I said, this is why we trade.

Jay Kaeppel

The Pound in the Balance

OK, I know that the British Pound is not a market that most people follow.  Still, at times it pays to remember:

Jay’s Trading Maxim #312: Opportunity is where you find it, not necessarily where you want it to be.

(Hey, that one’s pretty good….I must have stolen it from someone.  Anyway…)

See also JayOnTheMarkets.com: Jay Kaeppel Named Portfolio Manager for New Investment Program

I wrote about this awhile back and since that time the Pound (I am using ETF ticker FXB here instead of British Pound futures simply based on the guess that 99% of the people who read this have never and will never trade British Pound futures) has mostly traded sideways.  In the last several sessions the Pound has tried to breakout to the upside but has been unable to.

(Also the Sep 153 put that I highlighted at $1.80 is presently trading at $1.05 – illustrating the negative effects of time decay.  Still, that trade can make money quickly if FXB sells off prior to September expiration)

1Figure 1 – FXB at a critical juncture (Courtesy: ProfitSource by HUBB)

The Elliott Wave count as shown in Figure 2 is still pointing to the possibility of a meaningful price decline.  So for those who are willing to accept the “mental risk” (meaning that there is a good chance you might end up kicking yourself and saying “why did I do something so stupid and impulsive?”) a short-term bearish trade with a stop above recent highs could offer a very high profit-to-risk ratio (again with the caveat that the probability of profit may be low since a tight stop will be used).

2Figure 2 – Bearish Elliott Wave projections for Daily (top) and Weekly (bottom) FXB charts (Courtesy: ProfitSource by HUBB)

Playing with Options

What follows is not a recommendation but rather an example of a simple “way to play.”  IMPORTANT NOTE: The option used in the following example has an Open Interest of exactly 0. It also has a wide bid/ask spread so anyone tempted to “take the plunge” should make note slippage is inevitable if a quick exit is called for.  Also, nothing less than a meaningful decline in FXB will allow this option to generate a profit.  That being said:

This trade involves buying the at-the-money December 154 put.  The bid is $3.00 and the ask is $3.30.  To assume a worst case scenario we will assume the position is entered with a market order at $3.30 (a real life trade might be wise to put in a limit order to buy at $3.15 or $3.20).

3Figure 3 – FXB Dec 154 Put (Courtesy www.OptionsAnalysis.com)

As you can see, one of two things will happen, either:

*FXB will fall and this trade will generate a substantial profit (percentage wise).

*FXB will not fall, in which case the trade will lose a maximum of $330.

A couple of notes:

*If FXB takes out the recent high of $156.04 a trader can consider getting out at that point.

*If FXB falls to its recent low the trade can make roughly $200.

*If FXB falls to the upper Elliott Wave projected range of 139.77 this trade can make over $1,000

Summary

This type of (“example” not “recommendation”) trade is “for speculators only.”  The primary reason is that it holds the potential to make a person feel very stupid very quickly.  All FXB has to do is rise a little bit to the upside and the whole basis for the trade (resistance near 154 and a bearish EW projection) collapses.

Still, opportunity is where you find it.

Jay Kaeppel


When NOT to Own Gold Stocks

Figuring out when to invest in gold stocks can be a pretty tricky proposition.  Especially when they are in a relentless bear market.  But figuring out when NOT to be in gold stocks may not be quite so tough.

For as it turns out there are some fairly consistent “unfavorable periods” for gold stocks on an annual basis.

Four Annual “Unfavorable Periods”

There are four times of year when gold stocks generally perform poorly – often even in a bull market.  They are:

*February Trading Day #14 through May Trading Day #1

*May Trading Day #15 through June Trading Day #9

*July Trading Day #1 through July Trading Day #19

*September Trading Day #21 through October Trading Day #19

What You Miss by Being Out of Gold Stocks During These Periods

Figure 1 displays the growth (OK, as it turns out “growth” may be a poor choice of words) of $1,000 invested in Fidelity Select Gold Sector fund (ticker FSAGX) only during the periods listed above starting on 12/31/1988 through August 14, 2015.1Figure 1 – Growth of $1,000 invested in FSAGX only during four “Unfavorable Periods” each year (12/31/1988-8/14/2015)

Let me sum up the results displayed in Figure 1 in a word – OUCH!!

Figure 2 displays the results on a calendar year basis. Column 2 displays the annual performance of gold stocks during all periods not listed above – i.e., essentially the “Non unfavorable periods”.  Column 3 displays the performance of gold stocks during all four periods listed above on an annual basis.

2

Figure 2 – Annual Results for “Non Unfavorable” and “Unfavorable” Periods

* – Annual Average calculated through 12/31/2014

For the record, note the annual results displayed in Figure 3: 1Figure 3 – Annualized Results

Now before anyone gets too excited please note that an investors holding FSAGX only during the “Non unfavorable periods” would have witnessed a loss of -28.8% in 2011 and a whopping hit of -50.4% in 2013.  So do not get the idea that “Non unfavorable” is the same as “Bullish.”

Remember that the real focus of this article is the “Unfavorable Periods” during which gold stocks lost about -98% over the course of 26 years – which kind of takes some doing.

Summary

Bad things can (and have) happened to gold stocks during “Non unfavorable periods”.   On the other hand, good things rarely ever happen to gold stocks during the “Unfavorable Periods” I listed earlier.

The bottom line:

*Do not assume that gold stocks will perform well when the calendar is not in one of the four unfavorable periods listed earlier.

*Do not expect gold stocks to perform well at all when the calendar is within one of the four unfavorable periods listed earlier.

In sum, the difference between:

*a gain of +4,584% (during all non unfavorable periods) and

*a loss of -97.9% (during all unfavorable periods)

…is what we “quantitative analyst types” refer to as “statistically significant.”

FYI: The next “Unfavorable period” for gold stocks begins at the close on 9/30/2015 and extends through the close on 10/27/2015.

Jay Kaeppel

About That ‘Inevitable/Calamitous’ Interest Rate Hike

It is pretty much impossible to read the financial press without hearing about the “inevitable” Fed rate increase.  And of course, “everyone knows that”,

a) the Fed will raise rates and that,

b) this will trigger [insert your worst fear here].

Now I am not making any predictions here myself.  I mean on the one hand, with short-term rates hovering around 0% and having done so for some time now, yes, a rise in interst rates does seem fairly inevitable at some point.  Still, having been around the block a time or two all I can say is that when “everyone knows” that Event A is sure to happen and that when it does then Event B is sure to follow, well, let’s just say that “things” have a way of not following the script.

Still, it might make sense to start thinking about a potential hike in interest rates.  So let’s look at one hypothetical play using options on ticker TBT, an ETF that trades the inverse of the long-term treasury bond times two (i.e., if the long-term treasury bond falls by 1% ticker TBT should rise roughly 2%).

0Figure 1 – Ticker TLT versus ticker TBT (Courtesy AIQ TradingExpert)

IMPORTANT NOTE: I am not offering what follows as a “recommendation”, only as an example of one, er, three ways to play.

Trade #1: Near-the-Money Bull Call Spread

The first trade is a close-to-the-money bull call spread buying the Dec 43 call and selling the Dec 48 call.1Figure 2 – TBT Dec 43-48 Bull Call Spread (Courtesy www.OptionsAnalysis.com)

2Figure 3 – TBT Dec 43-48 Bull Call Spread (Courtesy www.OptionsAnalysis.com)

The good news for this trade is that TBT needs only to rise 3%+ in order to exceed its breakeven price of $44.73.  The bad news is that the profit potential is capped at 189% even if rates (and by tension ticker TBT) were to rise substantially.

Trade #2: Far-Out-of-the-Money Bull Call Spread

The second trade is a far out-of-the-money bull call spread buying the Dec 54 call and selling the Dec 59 call.

3Figure 4 – TBT Dec 54-59 Bull Call Spread

4Figure 5 – TBT Dec 54-59 Bull Call Spread (Courtesy www.OptionsAnalysis.com)

The good news for this trade is that the profit potential is +1,900%.  The bad news is that the breakeven price (at December expiration) is 25% above the current price (although a rise in TBT in the near term might create a profit opportunity).

So from these two examples a trader has to either choose “Higher probability and lower profit potential” or “Lower probability and higher profit potential”.  But before “choosing” let’s look at one alternative.

Trade #3: Combining Near and Far Bull Call Spreads

This trade simply involves entering both trades simultaneously in a ratio of 6-to-1 (in other words buying 6 Dec 54-59 spreads for every 1 Dec 43-48 spreads purchased).

As you can see this creates a trade that has a reasonably obtainable breakeven price of $46.23 and substantial profit potential of +983%

5Figure 6 – TBT Dec 43-48 plus 54-59 Bull Call Spread (Courtesy www.OptionsAnalysis.com)

6Figure 7 – TBT Dec 43-48 plus 54-59 Bull Call Spread (Courtesy www.OptionsAnalysis.com)

Figure 8 compares the three trades.

Measure 43-48 Spread 54-59 Spread 43-48 + 54-59
Breakeven $44.73 (+3.1%) $54.25 (+25.1%) $46.23 (+6.6%)
Max Profit % +189% +1,900% +983%

Figure 8 – Breakeven and Profit Potential Comparisons

Summary

I feel the need to point out the fact that I am not necessarily claiming that right this very minute is the time to get bullish on TBT.  It’s been pretty weak for quite some time.  But, a) it is sort of near support (maybe) and, b) an interest rate hike is “inevitable” right?  (I mean “everyone knows” that – or at least so I am told…repeatedly, ad nauseum, day in and day out, thanks for the update, you can stop now thank you…..).

Also, I am not claiming that trades 1, 2 or 3 are actually great trades.  They are merely examples of limited dollar risk ways to play higher interest rates.  Trade 3 offers a tradeoff between reasonable probability (a 6.6% move in TBT is quite often child’s play) and outstanding potential profitability (+983%)

So there are three basic questions for any trader to ask and answer:

1) Will interest rates rise?

2) If rates will rise, how soon will they rise?

3) If rates will rise, how far will they rise?

Depending on your own answers to these questions, the proper course of action for you might be to:

a) Buy a near-the-money bull call spread on TBT

b) Buy a far-out-of-the-money bull call spread on TBT

c) Combine to spread as shown in Figures 5 and 6

d) Take no action at all

Choose wisely.

Jay Kaeppel


I’m Back on Land…and On-Line

Hello again.  The family and I went on a Caribbean cruise the first week of August.  Now if you happen to live in the Southeastern U.S. you may be thinking “A Caribbean cruise in August…..are you crazy?”  as this is the start of hurricane season.  Hey, I’m a speculator…and the price was right.

Bottom line: We had a great time and the weather was great!  More to the point I decided to “unplug” for the week.  Oh, I did manage to check the markets a couple of times but that was it.  After some early “withdrawal symptoms” I “sailed” (har) through the rest of the week.

Following up on these articles I did notice that:

a) Some of the major stock market indexes have dropped below their 200-day moving averages (while others did not);

b) AAPL took out support at $119.22 and fell as low as $112.10 before bouncing…er, sort of, and;

c) The British Pound (ticker FXB) crept lower.

Have to get back up to speed on things and hopefully I can think of something reasonably intelligent to say about the state of the markets in the next several days.

Jay Kaeppel


An eMini S&P Update on my “Simple Pattern” for Trading

As I wrote about here and here, there is a simple 3-day pattern that I like a lot.  I liked a lot again the last several days.

In nutshell:

Day 1) Closing price is below the low of the previous day

Day 2) The next day involves no action

Day 3) If the high today takes out the high for Day 2, then buy long and sell at the first profitable close (a stop-loss order is recommended but where to place it is an entirely different topic and one that might require a little experimentation on your own).

If the high for Day 3 DOES NOT take out the high for Day 2 then the pattern is invalidated.

Figure 1 displays all of the Day 3’s on which there would have been an entry signal in the eMini S&P 500 futures contract.1Figure 1 – Jay’s Simple Three-Day Pattern in EMini S&P 500

Last two signals:

#1

Day 1) On 7/24 ES closed below the low on 7/23

Day 2) 7/27 serves as Day 2

Day 3) ES opens on 7/28 above Day 2 high at 2071.25

ES closes on 7/28 at 2087.25

(2087.25 – 2071.25) * 50 = +$812.50 per contract

#2

Day 1) On 7/27 ES closed below the low on 7/24

Day 2) 7/28 serves as Day 2

Day 3) On 7/29 ES trades above Day 2 high of 2089.00.  Buy at 2089.25 sell on close at 2101.50.

(2101.50 – 2089.25) * 50 = +$625 per contract

Summary

Like every other trading method I know of, it sure is great.

Especially when it works…..

Jay Kaeppel


Important Things to Watch Right Now (Part 3-Ticker FXB)

Ticker FXB is an ETF that is designed to track the price action of the British Pound.  OK, now I suppose the first reaction for some readers might be to say:

“Wait, I thought you were going to talk about important things.”

And I get that.  When people think of “trading”, the British Pound is typically not the first thing that pops into their mind.  But remember:

Jay’s Trading Maxim #312: Opportunity is where you find it (not necessarily where you want it to be).

And an opportunity may be brewing in the British Pound.

(See also Important Things to Watch Right Now Part 1 and Part 2)

As you can see in Figure 1, FXB price action has formed a short term wedge with price action closing into a very tight range.  On 7/28 price broke out to the upside.  This by itself is not (in my opinion) enough to trigger any action.

1Figure 1 – FXB narrowing price action w/upside breakout (Courtesy: ProfitSource by HUBB)

What I will be watching for is to see if this upside breakout fails.  Because if it does there could some serious downside potential.  The two charts in Figure 2 display the weekly and daily Elliott Wave counts from ProfitSource by HUBB for ticker FXB.

(click to enlarge)2Figure 2 – Weekly and Daily Elliott Wave counts or ticker FXB (Courtesy: ProfitSource by HUBB)

*The daily count has recently completed a five-wave up pattern.  This suggests (albeit for the record, in no way guarantees) limited upside potential in the near-term.

*The weekly count is suggesting that if price starts to break lower it could fall precipitously with a downside target below 140 (from current level around 153).

The purest play would be to sell short British Pound futures contracts.  This also entails significant risk.  Another possibility – and one that involves limited risk – is to buy a put option on ticker FXB.

IMPORTANT NOTE: FXB options are very thinly traded so trading in large quantity might be difficult.  The good news is that although the bid/ask spreads are not necessarily “tight” there are reasonable.  In any event, a trader should consider using limit orders when entering into a position.

One possibility would be to buy an at-the-money put option as displayed in Figures 3 and 4.3Figure 3 – FXB Sep 153 put (Courtesy www.OptionsAnalysis.com)4Figure 4 – FXB Sep 153 put risk curves(Courtesy www.OptionsAnalysis.com)

Note that this option enjoyed a trading volume of exactly 0 and a bid/ask spread of over 5% (1.75 bid/1.85 ask).  Hence the reason limit orders are important.  Still, the primary focus in the opportunity to “risk a little to (maybe) make alot.”

Summary

The bottom line is this:

*There is no guarantee whatsoever that the Pound will be heading lower anytime soon, particularly as sharply lower as projected in the weekly chart in Figure 2.

*FXB options are thinly traded so traders need to pay close attention to bid/ask spreads

*I am not recommending the trade displayed in Figures 3 and 4 – it serves only as an example of “one way to play.”

*The trade shown is Figures 3 and 4 qualifies as nothing more than “speculation”.  For the price of $185 a trader accesses the “potential” (nothing more, nothing less) to gain $1,200 to $1,700 if the British Pound does in fact reverse back to the downside.

Jay Kaeppel


Important Things to Watch Right Now (Part 2-Ticker AAPL)

If you had to pick one stock that gets more attention than any other I think most people would name Apple (ticker AAPL).  As such a widely recognized company its stock represents a major holding in many, many investment portfolios.  As a result of its “leadership” position it can be important to pay attention to the action of its stock.

The latest action in AAPL might give us some pause.  After a long advance form $55 a share in June of 2013 to $134 and change in May of 2015, it can be argued that the chart has formed a head-and-shoulders formation.  For the record, I would guess that some technicians would argue that the formation does not exactly fit the classic head-and-shoulders pattern.  But the primary point is that the stock has taken a couple of shots at breaking out to the upside and has been unable to do so. 1Figure 1 – AAPL at the crossroads

The stock hit a high in late February then fell back and then rallied to a slightly higher high in early May.  In late May and again last week AAPL trie to rally up to the early May high but failed to break through.  Does this mean that this is the “end of the line” for AAPL?  Hardly.  But it does draw a potential resistance area.  In other words, unless and until AAPL breaks out above $134.54 the bull run is in hibernation.

The lowest low recording during the formaiton of the purported head-and-shoulders pattern was $119.22.  So that represent our support “line in the sand”.  According to classic head-and-shoulder theory:

*If AAPL takes out the lowest low achieved while the H and S pattern was forming;

*Then the downside target is equal to the broken support level ($119.22) minus the difference between the high and low within the H and S pattern ($134.54-$119.22 = $15.32), or $103.90 ($119.22 – $15.32).

So keep a close high AAPL. Whether it breaks $134.54 to the upside or $119.22 to the downside could provide an important clue as to what is next for the stock and the overall market.

Jay Kaeppel


Important Things to Watch Right Now (Part 1-Major Market Indexes)

If we look at the four ETFs that track major stock market indexes displayed in Figure 1 – DIA, SPY, IWM and QQQ – we find that three are either flirting with or already below their respective 200-day moving averages and the 4th (QQQ) is threatening to break down through a key technical level.1aFigure 1 – Indexes “on the brink”

We “technical analysis types” make a big deal out of crosses above and below the 200-day moving average.  In reality there is nothing “magical” about this average.  I mean, why not 176 days or 215 days?  The implication is always that if a particular index breaks below its 200-day moving average then a major bear market is about to unfold.  That’s not exactly the proper way to look at.  Moving average don’t “predict” anything, they just tell you the trend “right now.” Which, as it just so happens, is pretty valuable information.  I mean if the trend of the stock market isn’t bullish then why would I want to be fully invested?

There are three key things to remember:

1) You cannot have a major, long-term bull market while price is below the 200-day average;

2) You cannot have a major, long-term bear market while price is above the 200-day average;

3) Whipsaws are a fact of life when dealing with moving averages – i.e., not every break above or below the 200-day average will end up being significant.

The bottom line is this:

The more indexes that drop below their 200-day average and the longer they spend below said averages the greater the danger of a more serious bear market decline.  So it pays to pay attention.

Jay Kaeppel