See Jay’s latest post: One More Plunge for Crude Oil?
As I admitted in my last post, I am a something of a trading “systemaholic”.
And yes, on many occasions I have started out with a simple idea and by the time I was done I had 600 lines of code and only a vague recollection of what that original simple idea was. So take it from me: While “complex” can be good, in the end the complexity of a trading method typically says very little about the ultimate usefulness of said trading method.
And yes, “simple” can definitely be beautiful. So let’s look at a simple pattern.
Jay’s “Simple Pattern” Defined
To generate a buy signal this method looks for a particular 3-day pattern while the security in question is above its 200-day moving average.
*Filter: Security is trading above its 200-day moving average
*Day 1: Security closes below the low of the previous day
*Day 2: The day after Day 1 has no trading significance
*Day 3: Buy if the high of Day 3 is greater than the high of Day 2 (if no buy occurs on Day 3 the pattern is voided)
*The default is to buy at the Day 2 high plus ??? ($0.02?). This would involve placing a stop order prior to the trading of Day 3. But traders are encouraged to experiment with other entry methods.
*Set a stop-loss (open to discussion as to how far away to place stop)
*If not stopped out, then Exit on the first profitable close
That’s it.
This can also be utilized using weekly data, just use a 30-period (week) moving average as a trend filter rather than a 200 period moving average.
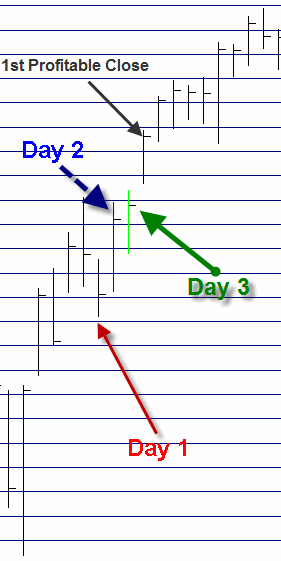
Example #1
Day 1 – the close is below the previous day’s low
Day 2 – the day after Trading Day 1
Day 3 – price breaks above Day 2 high triggering a long trade
1st profitable close occurs on day after Day 3
Example #2
Day 1 (1st red arrow) – the close is below the previous day’s low
Day 2 (1st blue arrow) – the day after Trading Day 1
Day 3 (not marked) – price DOES NOT exceed Day 2 high, so signal is voided
Day 1 (2nd red arrow) – the close is below the previous day’s low
Day 2 (2nd blue arrow) – the day after Trading Day 1
Day 3 (green arrow) – price DOES exceed Day 2 high, trade is entered above Day 2 high
1st profitable close – Price closes above entry price on Day 3 so trade closed there
Hopefully these examples help.
Jay’s “Simple Pattern” in Action
For the sake of example, let’s look at a daily bar chart for ticker IYR. In Figure 1 you see the daily chart with arrows drawn on all trading days that closed below the previous day’s low. these days represent Day 1 in the pattern above. Figure 1 – Ticker IYR with closes below previous low marked (this constitutes Day 1) (Courtesy: AIQ TradingExpert)
Not every Day 1 signal generates an entry signal. If the 2nd trading day after the “close below previous low” (Day 3) does not trade above the high of the day after the “close below previous low” day (Day 2), then no further entry signal exists and the pattern is voided.
Figure 2 displays ticker IYT with Day 3 highlighted only when an entry signal occurs.
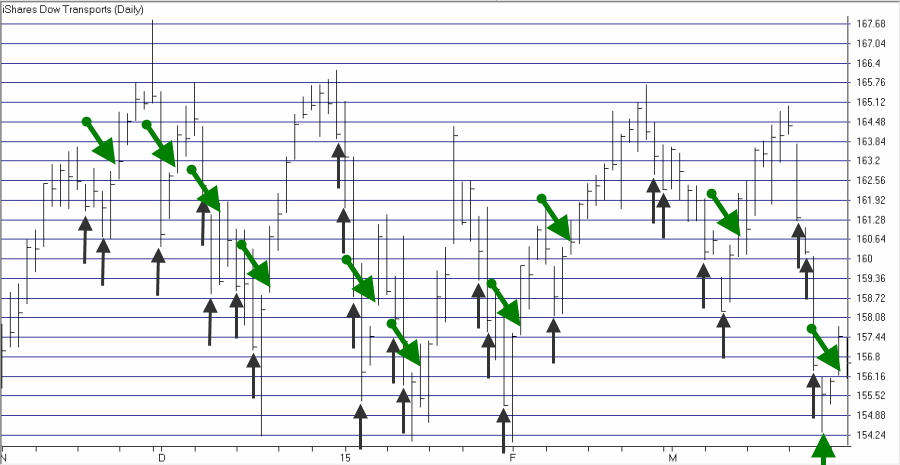 Figure 2 – Jay’s “Simple Pattern” Day 3 entry Signals for Ticker IYT (Courtesy: AIQ TradingExpert)
Figure 3 displays IYT “Simple Pattern” buy signals using a weekly bar chart.
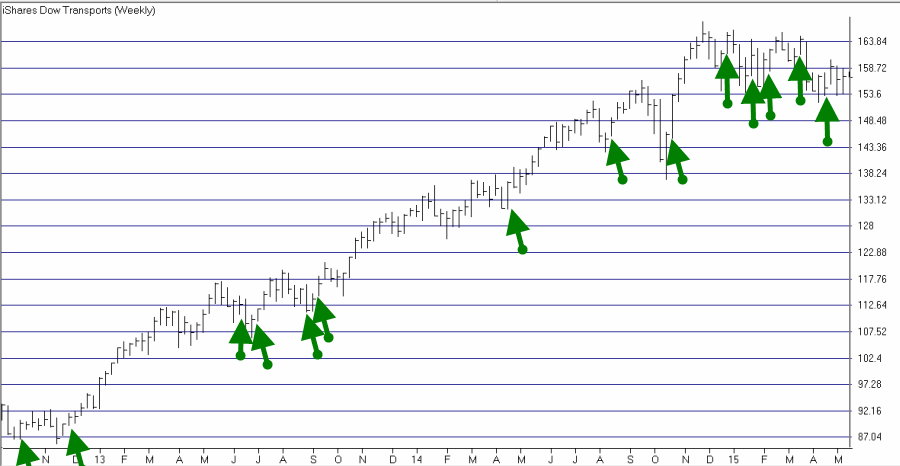 Figure 3 – Jay’s “Simple Pattern” Day 3 entry Signals for Ticker IYT using Weekly Chart (Courtesy: AIQ TradingExpert)
The Difference Between a Trading “System” and a Trading “Method”
In my (troubled) mind:
*A trading “system” invokes a specific set rules that tell the trader exactly when to buy and sell.
*A trading “method” is merely a set of criteria that helps to identify trading opportunities and typically comprises part of a trading system.
I consider this “Simple Pattern” to be more of a “Method” than a “System”. Still for arguments sake, if I:
*Use it systematically using daily eMini S&P 500 data
*Subtract 0.25 S&P points for slippage & commission per contract buying and selling
*Use a stop-loss of 40.00 S&P points (a very wide stop FYI)
*Buy a 3-lot on each signal
*Exit on the first profitable close (if not stopped out)
I get the following hypothetical results starting in January 2007:
*Cumulative Gain= $67,163
*Maximum Drawdown = $11,400
*# Winning trades = 123 (88%)
*# Losing trades = 17 (12%)
*Average $ win = $1,203
*Average $ loss = (-$4,754)
The hypothetical growth of equity appears in Figure 4.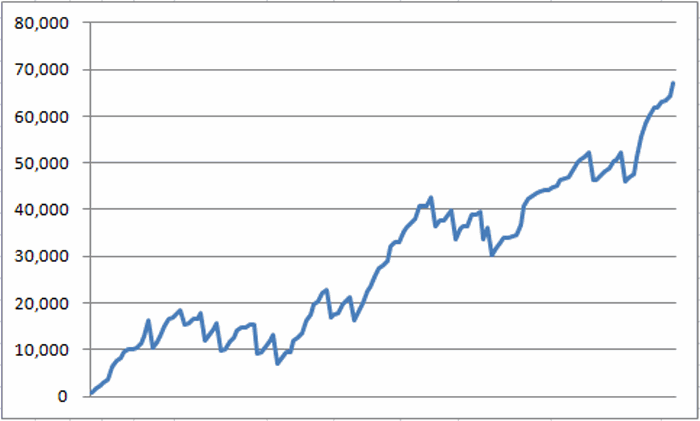 Figure 4 – Hypothetical results trading 3-lot of eMini S&P using Jay’s “Simple Pattern”; 2007-Present (Courtesy: AIQ TradingExpert)
Figure 5 displays a “continuous” eMini S&P chart (front trading months strung together). “Day 2″‘s are highlighted in blue, “Day 3″‘s that resulted in a buy signal are highlighted in green.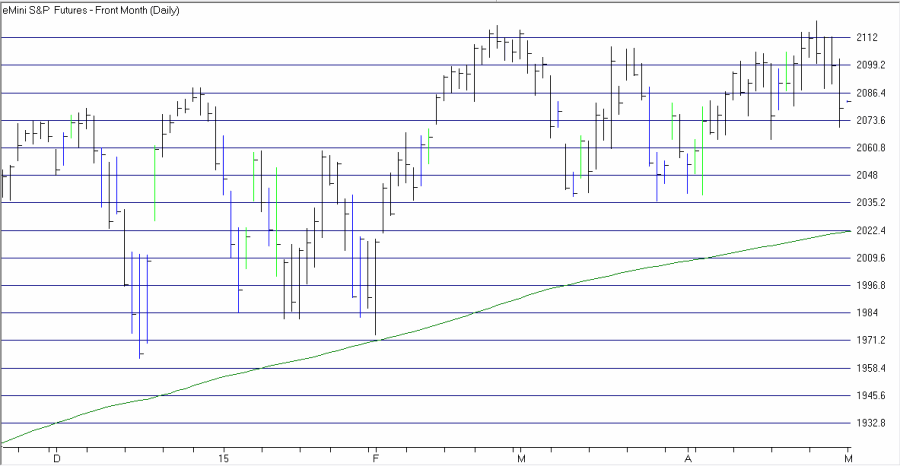 Figure 5 – EMini S&P futures with Days 2 in blue; Day 3 buy signals in green (Courtesy: AIQ TradingExpert)
Summary
So does this “Simple Pattern” constitute a viable standalone trading “system?” I leave you to figure that out on your own. But in any event the real point of this piece is simply to highlight the fact that when it comes to choosing a method or methods for trading in the financial markets, keep in mind:
Jay’s Trading Maxim #17: When it comes to the method you use to trade, remember, “It doesn’t have to be rocket science.”
Jay Kaeppel


Going to check this out, thanks Jay.
Question: are you buying at the close of day 3? Or the open of the next day? ( I assume you’re not buying at the high of day 3, otherwise you’d be psychic… 🙂 )
Good question. I have since added this to the post:
*The default is to buy at the Day 2 high plus ??? ($0.02?). This would involve placing a stop order prior to the trading of Day 3. But traders are encouraged to experiment with other entry methods.
Simple strategy, but very confusing post. Please make yourself more clear next time. This was especially baffling: “Not every Day 1 signal generates an entry signal. If the 2nd trading day after the “close below previous low” (Day 3) does not trade above the high of the day after the “close below previous low” day (Day 2), then no further entry signal exists and the pattern is voided.”
Nikita, well it made sense to me when I wrote it……but as I reread the portion you mentioned, well, um, you make a good point. I will take a look at updating the explanation and will try to avoid such muddled messes in the future. I do appreciate your candor. Take Care, Jay
Jay,
I saw your new post, much better, thank you!
How would this code look like in Easy language? Anyone want to share it?
/Sam