To sum up the current state of affairs in the bond market (at least as near as we can tell):
*“Everyone knows” that the Fed is “certain” to raise interest rates and soon.
*As a result, “everyone knows” that bond prices will be headed lower soon – as a rise in interest rates implies a decline in the prices for existing bonds (In fact, I wrote about one example way to play this very scenario here using options on TBT).
It is very difficult to find anyone who will argue vehemently against this scenario. Which leads us to this:
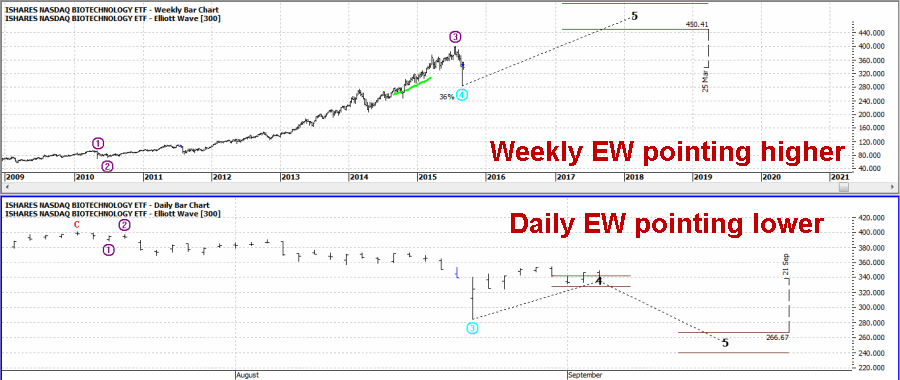
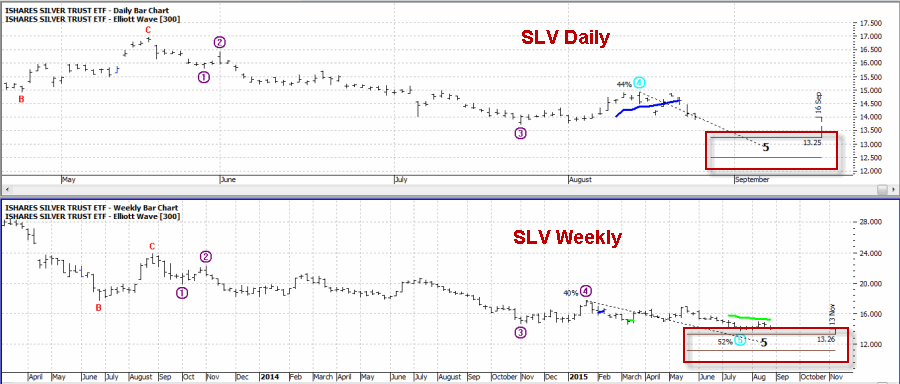
*The current weekly and daily Elliott Wave counts for intermediate-term treasury bonds are actually suggesting higher bond price in the months ahead (shown in Figure 1 below).
OK, talk about a “contrarian” point of view. A couple of key notes here:
*I am not necessarily agreeing with this outlook, I am only presenting it as a potential “contrarian” speculative play.
*Yes, Elliott Wave counts can be kind of a nebulous thing – i.e., one day everything is lining up bullish (or bearish) and the next day everything changes.
*Nevertheless I am relying here on ProfitSource by HUBB software which has an objective, built in mechanical method for calculating he wave counts and NOT on my own arbitrary interpretation of chart movements (which would be a really bad idea).
*Also, as I have touched on in the past, the only time I really pay attention to Elliott Wave is when the daily AND weekly counts are in agreement (which of course guarantees nothing, but has proven useful in identifying some potentially good speculative ideas in the past).
The “idea” I am about to detail I categorize as “rogue contrarian speculation” – and should be treated as such – i.e., there is the potential to look like a complete fool and end up asking yourself “what the heck as I thinking about.”
People who do not routinely speculate should not start with this one and people who do speculate should remember that only a small amount of capital (1% to 5% of trading capital) should be committed to any single speculative position.
Ticker IEF
Ticker IEF is an ETF that tracks the price of intermediate-term (7-10 years) treasury bonds. If intermediate-term interest rates rise this ETF will decline in price.
*Since “everyone knows” that the Fed is “certain” to raise short-term rates (which FYI is the only thing they control), it would…
*Seem fairly certain that as part of a ripple effect, intermediate term rates would also rise and..
*As a result intermediate term treasury bonds will decline in price.
And I am not prescient enough to say otherwise. Still, as you can see in Figure 1, both the weekly and daily Elliott Wave count are pointing higher. 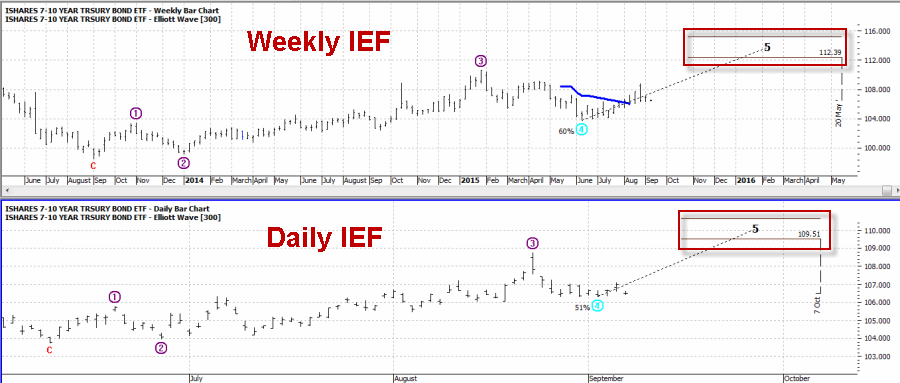 (click to enlarge)
Figure 1 – IEF Weekly and Daily Elliott Wave counts both pointing higher (Courtesy: ProfitSource by HUBB)
Given that “everyone knows” that rates are headed higher and bond prices are headed lower this is clearly a contrarian point of view.
Trading IEF
To consider entering a bullish option position in IEF is clearly a contrarian play. To buy 100 shares of IEF at $106.97 would cost $10,697. This seems like a lot of money to commit to a “rogue” idea. On the other hand the one problem with options on IEF is that the further out months are often thinly traded and tend to have wide bid/ask spreads.
So the prudent thing to do given all of this might simply be to walk away. But the “rogue contrarian speculator” is not afraid to “risk a few bucks” on an idea that others shun. So here is one “example” way to play.
One Rogue Contrarian Speculation Play in IEF
As always, I need to state that this is not a “recommendation”, only an “example”. But for arguments sake, there are some “requirements” involved:
*First off you have to be willing to “fly in the face of conventional wisdom” (which is another way of saying “you could end up looking like a complete idiot for ignoring what everyone else already knows”, and you have to be mentally strong enough to shake it off without a second thought, rather than sitting around kicking yourself wondering “how could I be so stupid”).
*Also, you will want to consider using “limit orders” for entering this trade (which can result in you not getting filled at all). Still given the width IEF option bid/ask spreads it is important to take steps to improve your odds as much as possible.
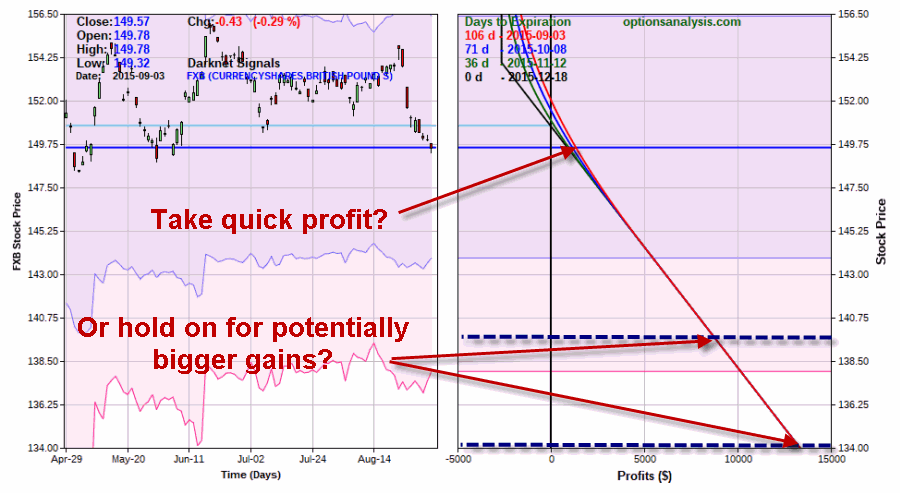
So one example way to play appears in Figures 2 and 3. The gist of this trade is to buy 3 January 107 call options and to sell 2 December 108 call options to pay for part of the January option position. Specifically:
*Buying 3 January 107 calls
*Selling 2 December 108 calls
To enter this trade with a market order you would pay $1.35 to buy the Jan. 107 and you would receive $0.60 to sell the December 108, or a spread of $0.75. Rather than settle for paying a wide bid/ask spread, we will assume that a limit order of $0.55 (buying at $1.25 and selling $0.70) is entered (and for examples sake) is filled at that price. Aggressive traders might consider an even smaller limit. Assuming a trader bought a 3×2 position at this price the position would cost $235 – which is 98% less than the $10,697 needed to buy 100 shares of IEF. $235 also represents the maximum risk for this trade as depicted in Figures 2 and 3.
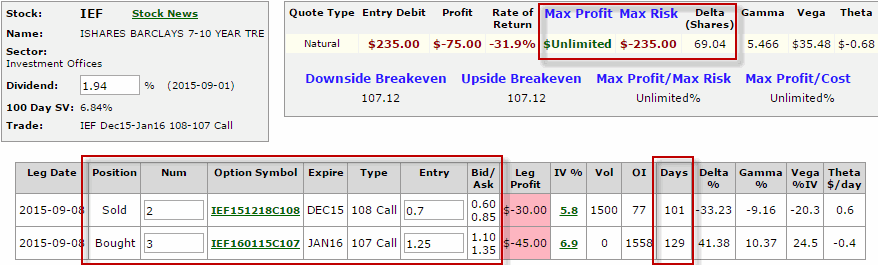 Figure 2 – IEF calendar bull call spread (Courtesy www.OptionsAnalysis.com)
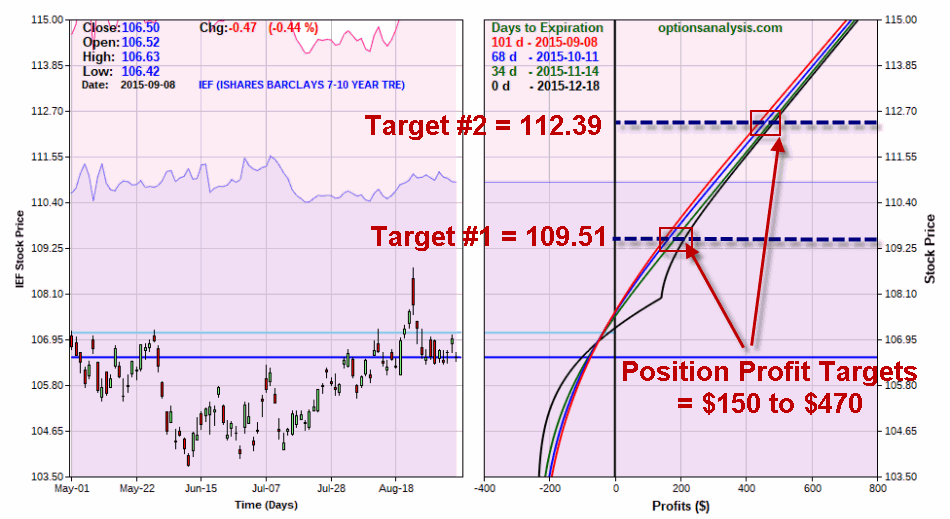 Figure 3 – IEF calendar bull call spread (Courtesy www.OptionsAnalysis.com)
One of several things will happen from here:
*If IEF drops back to the recent low near 103.50 this trade will lose $190 to $235, depending on how soon that price is hit.
*On the upside, if the lower Elliott Wave target of $109.51 on the daily chart is hit the trade will show a profit of $160 to $210, depending on how soon that price is hit.
*If the lower Elliott Wave target of $112.39 on the weekly chart is hit the trade will show a profit of $430 to $470, depending on how soon that price is hit.
Summary
So if this a good idea? Well, according to conventional wisdom “everyone knows” that betting on lower interest rates at this point in time is “obviously” a terrible idea. And again, for the record I am not offering this as a “recommendation”, but only as an example of a “rogue contrarian speculation” – how to risk a relatively small amount of capital to “bet against the crowd” (note that while “compliance types” cringe at the use of the word “bet”, in this case I believe it is the proper word choice – hey, if you aren’t willing to speculate the don’t speculate).
In other words, for a person who is willing to spit in the eye of conventional wisdom, there are usually ways available using options to “risk a couple of bucks” in return for the “potential” to make a pretty decent return if what “everyone knows” doesn’t pan out as everyone just knew it would this time around (which is pretty often when i comes to the the financial markets).
NOTE: It should be noted that the example trade detailed here and the one using TBT in the earlier link will NOT both make money at the same time. The IEF trade is bullish on intermediate-term treasury bonds and the TBT trade is bearish on long-term bonds. Theoretically, both trades could end up profitable at different times, but just be aware that if TBT calls are making money then IEF call options will be losing money and vice versa.
The bottom line:
Given the current state of affairs it seems highly implausible to expect intermediate-term bonds to rally strongly in the months ahead. But that’s not the real question that a rogue speculator would ask. The question he or she would ask is:
“Am I willing to risk $235 that they might?”
Jay Kaeppel
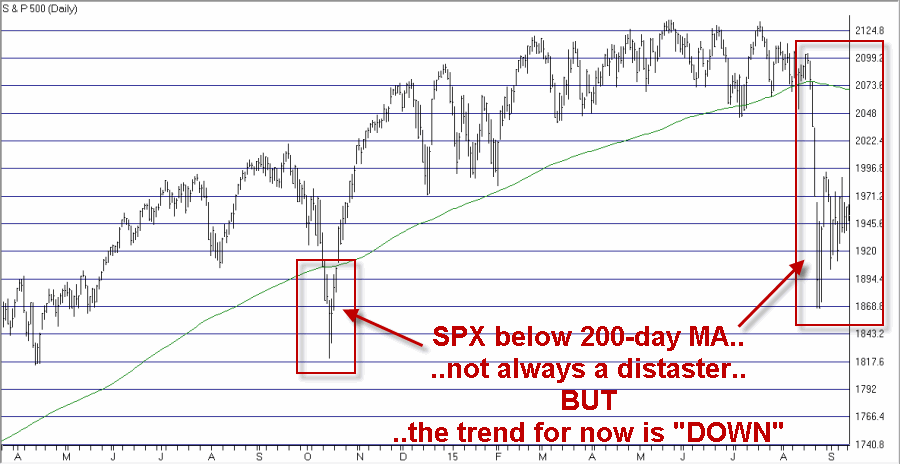
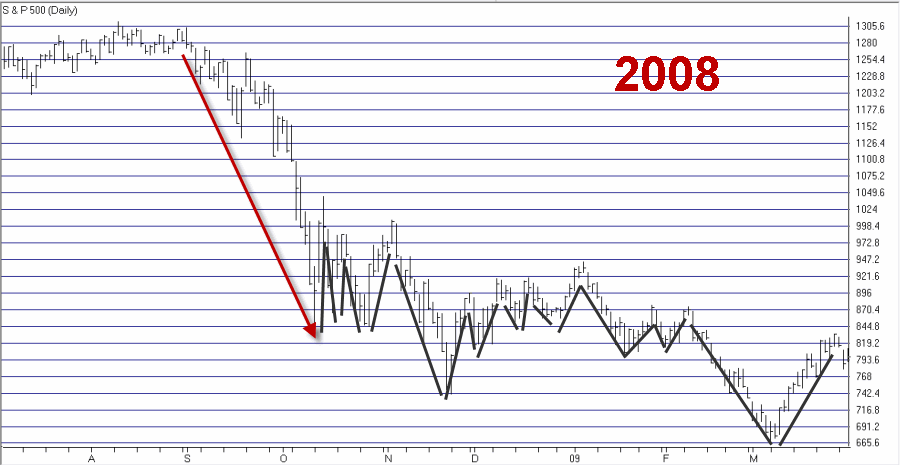
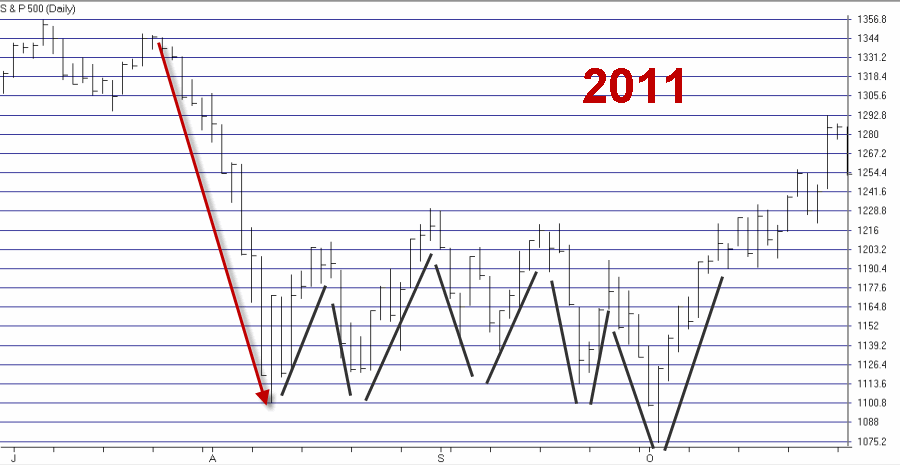
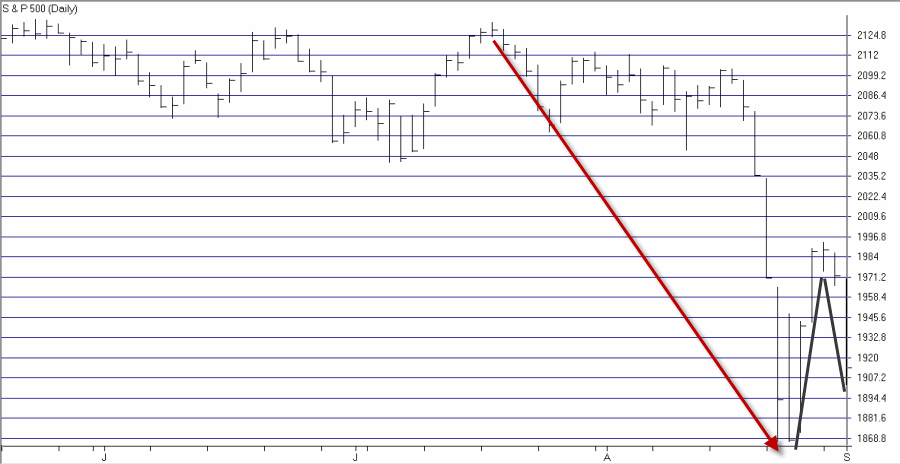
 Figure 1 – Major market averages all below respective 200-day moving averages (i.e., the trend is “down”
 Figure 2 – A failed upside breakout often (though not always) portends trouble
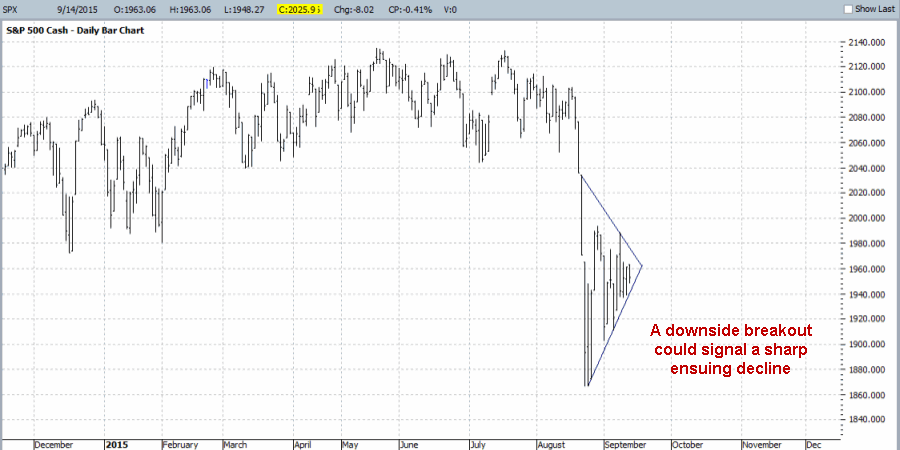
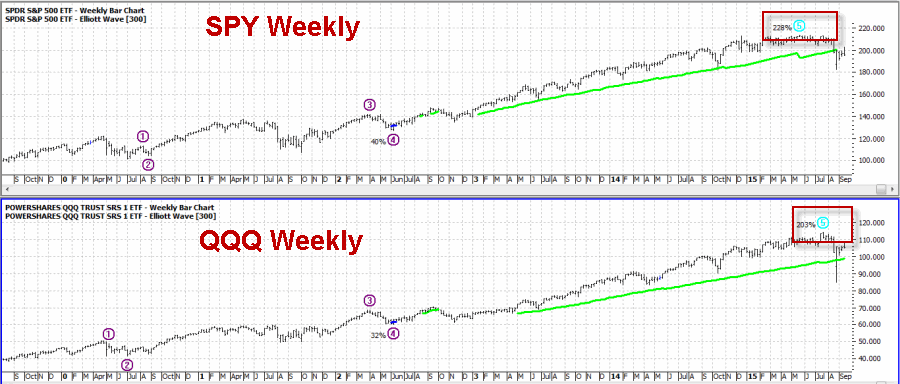 Figure 4 (click to enlarge) – SPY and QQQ Weekly Elliott Wave (completed 5 waves up)
 Figure 5 (click to enlarge) – SPY and QQQ Daily Elliott Wave (projecting sharply lower)