All Eyes on Crude Oil “In the Zone”

Looking at ticker USO as a proxy for crude oil we see that price is presently within a key support and resistance “zone”.1Figure 1 – Ticker USO with key support and resistance levels (Courtesy: www.freestockcharts.com)

As you can see in Figure 1, the price range bounded by $15.61 on the lower end and $16.45 on the upper end has served alternately as support or resistance on various occasions.

Classic technical theory would suggest that:

*An upside breakout above $16.45 would suggest higher prices to follow and;

*A downside breakout below $15.61 would suggest lower prices to follow.

If you want to trade oil, keep a close eye on these price levels in the hours and days ahead.

Jay Kaeppel

It’s All Hanging in the Balance RIGHT NOW!!!

Everything that was “down” is “up.”  Will it hold?

As a trader and/or investor you need to be paying close attention RIGHT NOW (!!!) to see what happens next.  Because what happens next may determine the overall trend(s) of things for some time to come.

Where We Stand

In an nutshell, many, many market that recently flipped in to a “downtrend” (i.e., price fell below a long-term moving average and/or a shorter-term moving average such as the 50-day average recently dropped below a longer-term moving average such as the 200-day average) have rallied sharply in the last week or so and are now “overbought” (based on any number of standard and not so standard overbought/oversold indicators).

This includes – but is not necessarily limited to:

*The major U.S. stock market averages (SPY/DIA/QQQ/IWM)

*A host of non-U.S. stock market averages (

*Energies

*Metals and mining stocks

A variety of charts appear at the end of this article so please be sure to scroll to the end.  WAIT!!!!! What I meant to say was “please keep reading to the end” (Thank You!).

So one of two scenarios is most likely about to unfold:

1. The “bottoms are in” and the recent upside reversals will serve as a “launching pad” of sorts for future gains in the months ahead.

2. Everything (figuratively speaking) is about to reverse back to the downside

Most of the charts below highlight the:

*Current overall trend (mostly “bearish” based solely on moving averages)

*The current “overbought status” (with an indicator or bearish Elliott Wave count highlighted)

*The “line in the sand” (i.e., the recent low)

What to Watch For

So here is what you should be watching for:

*If markets DO NOT reverse back to the downside soon then it is likely that some major bottoms are in place (particularly in  the stock market where the seasonal calendar tells us that from late October into January is the most bullish time of year for the stock market).

*If markets do start to reverse back to the downside:

1.Traders may consider short-term bearish trades intended to make some money if recent lows are retested and/to make a whole lot of money if recent lows do not hold

2.If markets reverse to the downside from here and take out recent lows then:

3.A serious bear (global) market will be confirmed and investors must be doing something besides just “holding on and hoping for the best”.

Summary

So to sum up what I basically have said so far:

“Either things will go up or they will go down”

So you’re thinking “Thanks Jay”.  Now this is the point where as a “professional market analyst” I should insert my “prediction” as to what I expect will happen and why.  And I would love to but the truth is that I am not too good at predictions.  Hence the reason I focus on trying to:

A) Respect the major trends (i.e., not just “holding and hoping” when a potential downtrend begins to unfold)

B) Trade the shorter-term trends – be they bullish or bearish

Lots of opportunities are setting up at the moment.  I will be watching closely to see which scenario plays out and will act accordingly.

I suggest that you do the same.

Charts

U.S. Stock Indexes

1Figure 1 – SPY (Courtesy: ProfitSource by HUBB)

We see that:

  1. The price trend is “bearish”
  2. The Elliott Wave count is “bearish”
  3. The 3-day RSI reached “overbought” territory

According to “classic technical analysis” this market “should” reverse to the downside and retest the “Line in the Sand”

Whether it “does” or “does not” do what it “should” do will provide incredibly important information going forward.

Non-U.S. Stocks

The same holds true for many foreign stock indexes.  See ticker EFA in Figure 2.2Figure 2 – Ticker EFA  (Courtesy: ProfitSource by HUBB

Crude Oil

Crude oil (using ETF ticker USO) is rallying sharply and is about to test a key resistance level at $16.50 a share.3Figure 3 Ticker USO (Crude Oil)  (Courtesy: ProfitSource by HUBB

Silver

Silver has rallied strongly and the ETF ticker SLV has moved slightly back above its 200-day MA.  Watch closely to see if this holds.5Figure 4 – Ticker SLV  (Courtesy: ProfitSource by HUBB

Gold Stocks

Gold stocks (using ETF ticker GDX) may have already reversed to bullish (see Elliott Wave count in Figure 5).  In the short run beware of potential seasonal weakness between now and late October4Figure 5 – Gold stocks (Ticker GDX)  (Courtesy: ProfitSource by HUBB

Jay Kaeppel

Tracking Gold With an “Anti-Gold” Index

In this piece I will detail an index that I created that I use in an effort to designate the trend of gold as either “bullish” or “bearish.”  But first some important notes:

(See also Fighting the Urge to Jump Into Gold Stocks…For Now)

I will say unabashedly that at first glance the results look pretty darn good.  That’s the good news.  The bad news is that there are a few caveats:

1. Because some of the components of the index only started trading in 2008, it has a very short history.

2. The components of the index became components of the index based primarily on their very low or inverse correlation to the price of gold.  It should be noted for the record that correlations between and among varying asserts can and do (and probably will) change over time.

So the bottom line is that the index that I will detail next may be useful as a tool to help confirm or deny a given trend in the price of gold.  But in no way does it serve as a “magic bullet.”

Jay’s Anti-Gold Index

I used AIQ TradingExpert to create a “Group” (although I heretofore will refer to it as an “index”) comprised of the following components:

Ticker GLL – ProShares UltraShort Short Gold ETF

Ticker RYSDX – Rydex Strengthening U.S. Dollar fund

Ticker SPX – S&P 500 Index

Ticker YCS – ProShares UltraShort Japanese Yen ETF

Each trading day the “Group” is updated by adding or subtracting the average gain or loss for that day for the four components listed.

Figure 1 displays Jay’s Anti-Gold Index in the top clip and ticker GLD (an ETF that tracks the price of gold bullion) in the bottom clip.  As you can see, the two tend to move inversely to one another.1Figure 1 – Jay’s Anti-Gold Index versus Ticker GLD

To identify a trend I add a couple of moving average filters.  Unfortunately (at least for the purposes of this article) one of them is pretty “long winded” in terms of calculations.  So I will include the calculations at the end of the article.

*Moving Average #1 = 36-period front-weighted moving average (calculations detailed at end of article)

Moving Average #2 = 55-week exponential moving average

A 55-week exponential moving average is calculated as follows:

(Prior week moving average * 0.964286) + (This week’s close * 0.035714)

The moving averages above are plotted against Jay’s Anti-Gold Index at the end of each week.

*If Moving Average #1 < Moving Average #2 on the chart of Jay’s Anti-Gold Index then the trend for GLD is BULLISH

*If Moving Average #1 > Moving Average #2 on the chart of Jay’s Anti-Gold Index then the trend for GLD is BEARISH

In other words, when the trend for Jay’s Anti-Gold Index is bearish then the trend for GLD is considered to be bullish and vice versa.2Figure 2 – Jay’s Anti-Gold Index versus ticker GLD

Summary

Like I said at the outset, at first glance tracking this index appears to be a pretty good way to identify the trend for gold.  For the moment, the Anti-Gold Index remains in a bullish trend, so by that measure ticker GLD remains in a bearish trend.

But just remember that the track record is likely too short to allow us to draw any definite conclusions as to its long-term usefulness.  Likewise, while the inverse nature of GLD versus GLL is not going to change (since GLL is simply a leveraged inverse gold fund) and the inverse nature of the U.S. Dollar versus GLD is not likely to change, the relationship between gold and the S&P 500 does change over time and the relationship between gold and the Japanese Yen (YCS is a leveraged short Japanese Yen ETF) can also change going forward.

So I am keeping an eye on the trend of Jay’ Anti-Gold Index (still bullish) but won’t “bet the ranch” based on its performance one way or the other.  Still, while the speculator in me is desperate to try to “pick a bottom” in gold, the pragmatist in me looks at the current (up trending) status of my Anti-Gold Index and counsel’s those timeless words:

“Patience, um, analyst, patience.”

Jay Kaeppel

Calculations for 36-week Front Weighted Moving Average:

!!! Front Weighted 36 Day Moving Average is similar to all other moving averages.
!!! The interpretation is just like with all the others, the trend is up when prices are
!!! above the moving average and the trend is down when prices are below the
!!! moving average. This particular variation attempts to weight the data at the front more
!!! than that at the back, with a sliding scale for each trading days value.

Bar34 is val([close], 34) * 0.01.
Bar33 is val([close], 33) * 0.01.
Bar32 is val([close], 32) * 0.01.
Bar31 is val([close], 31) * 0.01.
Bar30 is val([close], 30) * 0.01.
Bar29 is val([close], 29) * 0.01.
Bar28 is val([close], 28) * 0.01.
Bar27 is val([close], 27) * 0.01.
Bar26 is val([close], 26) * 0.01.
Bar25 is val([close], 25) * 0.02.
Bar24 is val([close], 24) * 0.02.
Bar23 is val([close], 23) * 0.02.
Bar22 is val([close], 22) * 0.02.
Bar21 is val([close], 21) * 0.02.
Bar20 is val([close], 20) * 0.02.
Bar19 is val([close], 19) * 0.02.
Bar18 is val([close], 18) * 0.02.
Bar17 is val([close], 17) * 0.03.
Bar16 is val([close], 16) * 0.031.
Bar15 is val([close], 15) * 0.031.
Bar14 is val([close], 14) * 0.031.
Bar13 is val([close], 13) * 0.031.
Bar12 is val([close], 12) * 0.031.
Bar11 is val([close], 11) * 0.031.
Bar10 is val([close], 10) * 0.031.
Bar9 is val([close], 9) * 0.031.
Bar8 is val([close], 8) * 0.031.
Bar7 is val([close], 7) * 0.006.
Bar6 is val([close], 6) * 0.006.
Bar5 is val([close], 5) * 0.07.
Bar4 is val([close], 4) * 0.07.
Bar3 is val([close], 3) * 0.07.
Bar2 is val([close], 2) * 0.07.
Bar1 is val([close], 1) * 0.07.
Bar0 is [close] * 0.079.

OneFrontWeighted36BarMA1 is bar34 + bar33 + bar32 + bar31 + bar30 + bar29 + bar28 + bar27 + bar26 + bar25 +
bar24 + bar23 + bar22 + bar21 + bar20 + bar19 + bar18.

TwoFrontWeighted36BarMA2 is bar17 + bar16 + bar15 + bar14 + bar13 + bar12 + bar11+ bar10 + bar9 + bar8 +
bar7 + bar6 + bar5 + bar4 + bar3 + bar2.

ThreeFrontWeighted36BarMA3 is bar1 + bar0.

FrontWeighted36DayMA is OneFrontWeighted36BarMA1 + TwoFrontWeighted36BarMA2 +ThreeFrontWeighted36BarMA3.

Feel free to use something “easier” – but beware of potential whipsaws in sideways markets.  JK

A “Crude” Setup

Alright if you are not an options trader you are dismissed from class…

…..BUT WAIT!!!!

Before you run off, are you aware that there are limited risk ways to play potential tops or bottoms in things like crude oil and silver….even in extremely volatile markets? If you want to know more, maybe stick around.

(See also Check on Tech in Late October)

Before proceeding I must emphasize that what I am about to show you is an “example” and not a “recommendation.”

A Setup in Crude Oil

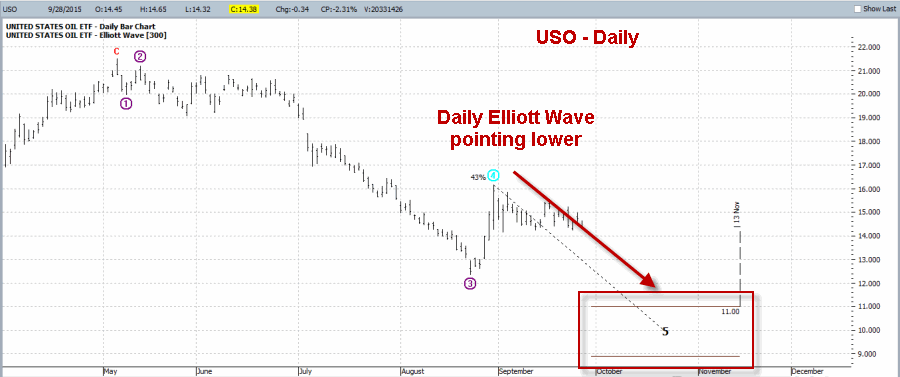
As you can see in Figures 1 and 2, both the weekly and daily Elliott Wave counts for ticker USO – an ETF that is designed to track the price of crude oil – are pointing lower.

1Figure 1 – Weekly USO Elliott Wave count pointing lower (Courtesy: ProfitSource by HUBB)

2Figure 2 – Daily USO Elliott Wave count pointing lower (Courtesy: ProfitSource by HUBB)

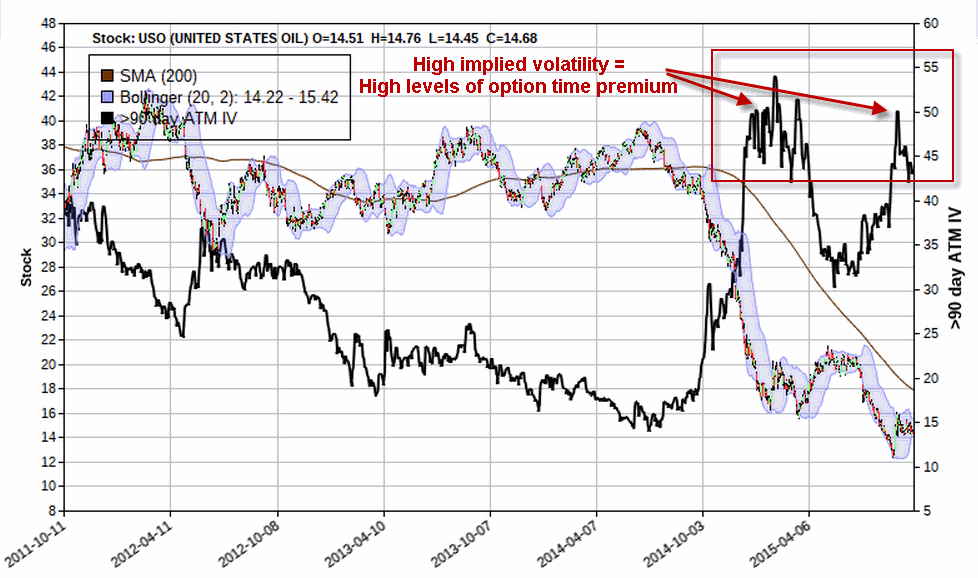
One possibility for a trader who wants to play the bearish side is to sell short shares of USO.  This is the most direct play on lower prices but does involve the use of margin and theoretically also involves unlimited risk. Another possibility is to buy a put option. This can cost very little and enjoys limited risk.  However, as you can see in Figure 3, the implied volatility for options on USO is presently at the high end of the historical range.

What this means to option traders is that there is an above average level of time premium built into USO options, i.e., USO options are “expensive”.  So if you buy a put option and volatility declines you can end up losing money due to volatility induced time premium decay, even if USO declines slightly in price.3Figure 3 – USO implied option volatility is extremely high (i.e., time premium levels are high, i.e., selling options makes sense)  (Courtesy www.OptionsAnalysis.com)

(See also Keep a Close Eye on, Um, the World (?))

A Trade to Take Advantage of USO Setup

The example trade for today is as follows:

*Sell 30 November 16 calls @ $0.47

*Buy 30 November 17 calls @ $0.26

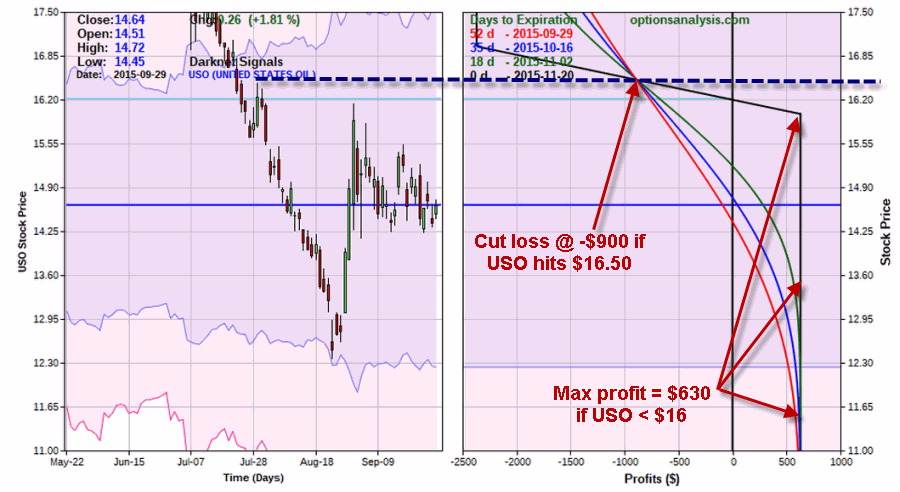
This maximum potential profit on this trade is $630 and the maximum potential risk is $2,370.  However, as we will see in a moment we will make plans to cut our loss at a much lower figure.

Also, with USO trading at $14.64 as this is written, the breakeven price for this trade is $16.21 and the full profit of $630 will be realized if USO is $16 a share or lower as of November expiration.

The particulars appear in Figures 4 and 5.4Figure 4 – November USO Bear Call Credit Spread (Courtesy www.OptionsAnalysis.com)

5Figure 5 – November USO Bear Call Credit Spread (Courtesy www.OptionsAnalysis.com)

Summary

Repeating now, this is an example and not a recommendation.  But for the record, the trade highlighted herein is well suited to profit if the Elliott Wave projections shown in Figures 1 and 2 pan out at all.  The primary concerns with this position are:

A) You are risking roughly $900 (and possibly more) in order to make $630.

B) You must be willing to act to cut your loss if USO does rise above the August high of $16.45.

The good news is that this trade can make money even if USO rises by as much as 10+%.

How will it all play out?  Only time will tell.

Jay Kaeppel

Check on Tech in Late October

Alright things are a bit disheartening out there in the stock market at the moment.  So let’s take a look ahead to a potential bright spot looming in the not too distant future.

See also JayOnTheMarkets.com: Keep a Close Eye on, Um, the World (?)

Believe it or not I am talking about technology stocks.  And why not? I mean who doesn’t like technology (especially when it works!)?  Sure the tech sector can be a scary place when the overall market is headed south.  Still, as it turns out, there is a time for everything.

Technology Seasonality

So why am I bringing up technology now of all times you may ask?  Do I, as a “professional market analyst” foresee “a coming boom” that will propel the majority of tech stocks based on “fundamental improvements” and a “new wave of new age”, well, whatever?  Um, not exactly.  OK, actually, not at all.  For I am a fairly strong adherent of:

Jay’s Trading Maxim #201: It is OK to make all the predictions you’d like regarding the financial markets.  Just don’t be stupid enough to risk a lot of money thinking that you’ll be right (more succinctly: Predicting the future is really hard).

So rather than taking up space spelling out all of my really amazing “predictions” for the world of technology and the profound impact that all of this will have on the performance of technology stocks, let me just put this out there:

Since October 1988:

-$1,000 invested in FSPTX between the close of October Trading Day #19 and February Trading Day #11 (or roughly 26% of all trading days) grew to $8,229 (or +723%).

-$1,000 invested in FSPTX during all other trading days (i.e., from mid-February into late October, or roughly 74% of all trading days) grew to $3,266 (or +227%).

So to put it another way:

-Tech stocks gained +723% during 26% of all trading days (late Oct. to mid Feb.)

-Tech stocks gained +227% during the other 74% of all trading days (mid Feb. to late Oct.)

So my trusty calendar reminds me to check back on tech stocks during late October….and not before then.

Jay’s Seasonal Technology Trading Strategy

Here is one way to play the typical seasonal strength in tech stocks between late October and early February:

-Using FSPTX as a proxy and as a trading vehicle (alternatives discussed later)

-Buy at the close on the 19th trading day of October (10/27/12 this year)

-Sell at the close the following day if FSPTX registers a gain of +12% or more

-Sell at the close the following day if FSPTX register a loss of -15% or more

-If neither target nor stop is hit, sell at the close of February Trading Day #11

Figure 1 displays the year-by-year results.  The years when the 12% profit target was hit are highlighted in green.  The years when the 15% stop-loss was triggered are highlighted in red.

.1

Figure 1 – Year-by-Year Results of Jay’s Seasonal Technology Strategy

All told:

*24 winners (89%)

*3 losers (11%)

*Average trade = +9.1%

*Median trade = +12.4%

*Worst loss = -17.3%

*# times +12% profit target hit = 17

*# times -15% stop-loss hit = 1

Figure 2 displays the daily equity curve for this system since 1988.

2Figure 2 – Growth of $1,000 using Jay’s Seasonal Technology Trading System (1988-Present)

Trading Alternatives

 Because it has certain switching restrictions – and because not everyone has a Fidelity account, it may be useful to consider alternative investment vehicles. Figure 3 lists a few potential choices.  There are others so you might want to do some homework, and just for the record I am not a fan of using leveraged ETFs for most strategies that last more than a few days.  But again, do your own homework before applying a leveraged fund to the strategy I’ve detailed.

3Figure 3 – Technology related alternatives to FSPTX

Summary

Remember that the seasonally favorable period for tech stocks does not begin until the close of trading on October 27th, 2105.  So this is just a “heads up” and I caution you against “jumping the gun”.  Even after October 27th, are technology stocks certain to embark on a meaningful advance?  Certainly not.  Should anyone “bet the farm” on technology stocks based on a reasonably strong seasonal trend?  Same answer.  But these are not the real questions.

The real questions are:

-Does it make sense to risk a reasonable amount of capital on a strategy that has generated 88% winning trades (21 of 24)?

-Even if that strategy involves nothing more than a calendar, a profit target and a stop-loss trigger?

I leave you to ponder your own answer.

Jay Kaeppel


Jay Kaeppel

Keep a Close Eye on, Um, the World (?)

See also Fighting the Urge to Jump into Gold Stocks (For Now)

In the world of technical analysis, there are a lot of techniques that one can consider. One common one works something like this:

1) A security declines sharply in price then bottoms.

2) After the bottom the security bounces higher

3) After the bounce the security turns down again and heads back toward the previously established low.

And then it gets interesting.  Because from there one of a couple of things typically happens.  Either:

4a) The previous low is broken and price begins another meaningful down leg, or;

4b) The previous low holds and a decent rally begins.

Stock market indexes around the globe are presently in Stage 3 above and headed for Stages 4a or 4b.  What happens from here is extremely important, so I suggest you keep a close eye on things in the near future.

A Glance Around the Globe

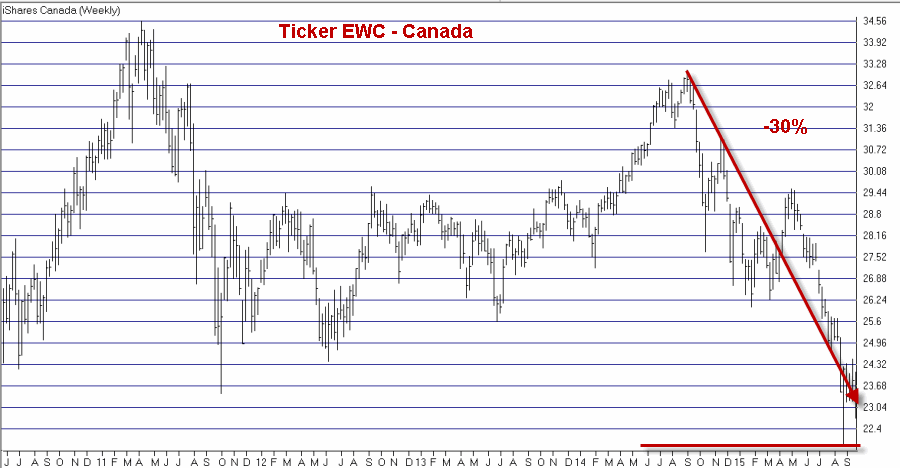
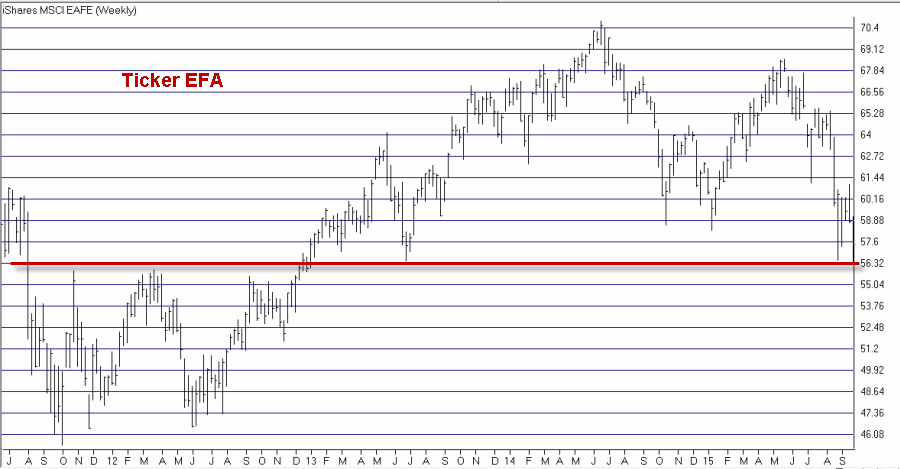
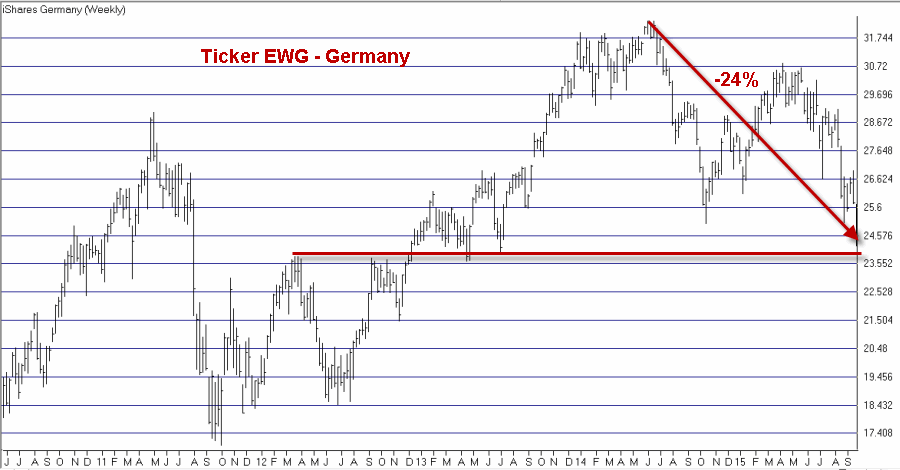
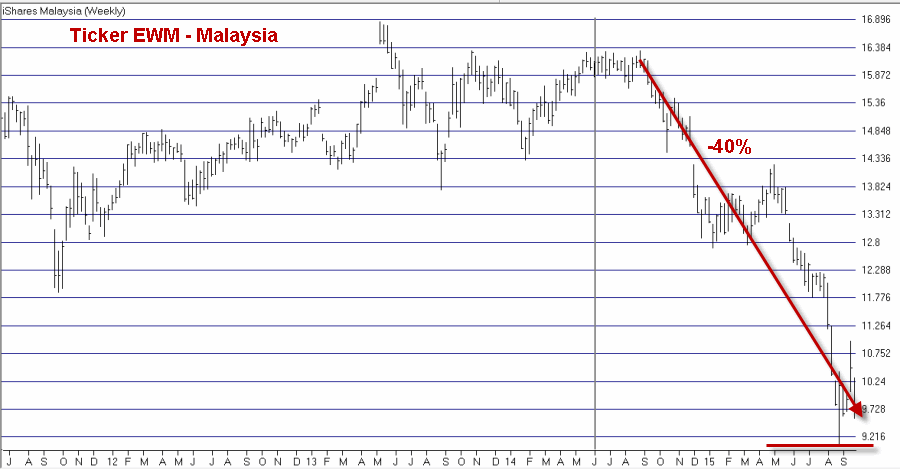
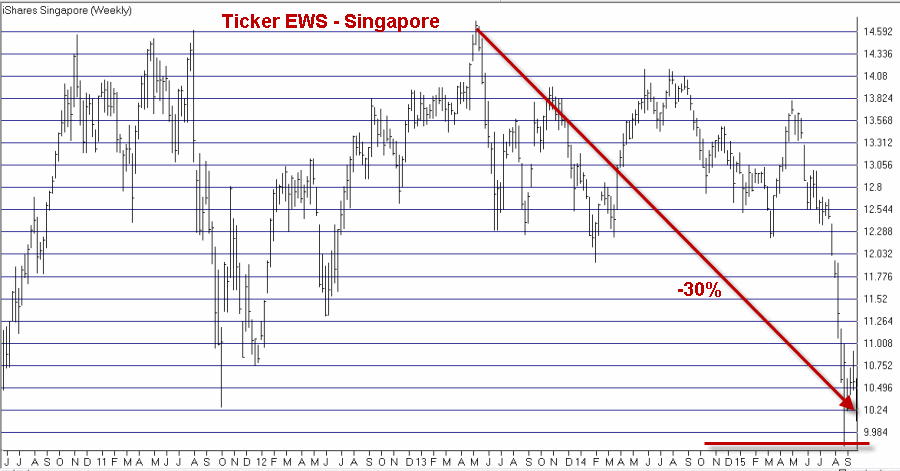
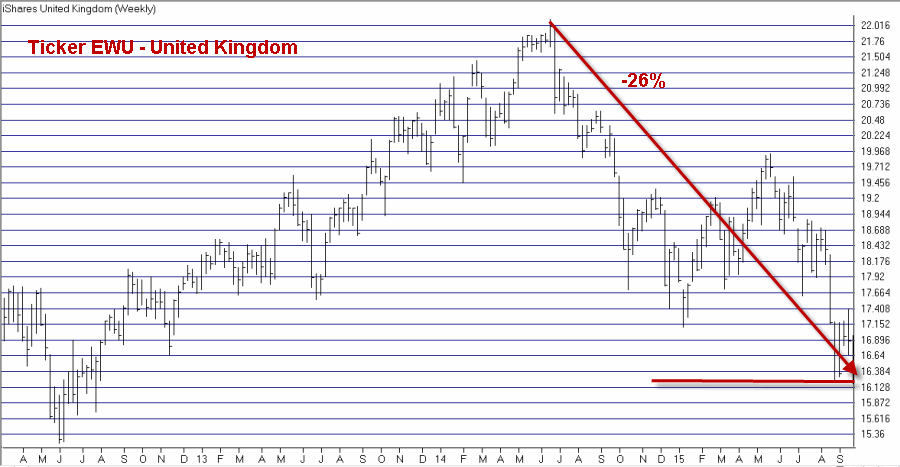
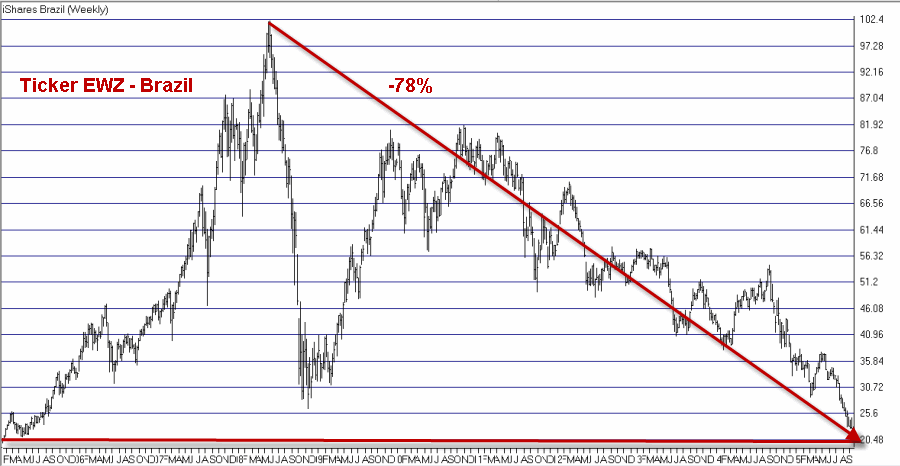
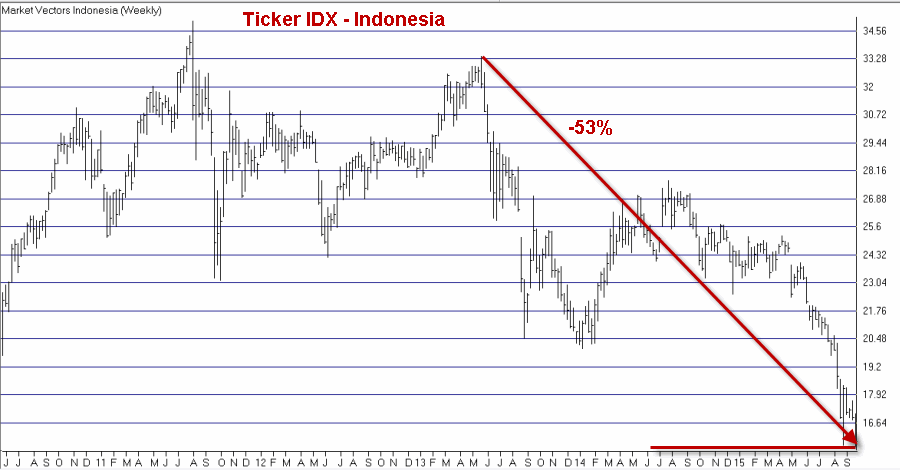
Just for “fun” please scroll through the charts below and for each one note that:

A) They have taken a significant hit

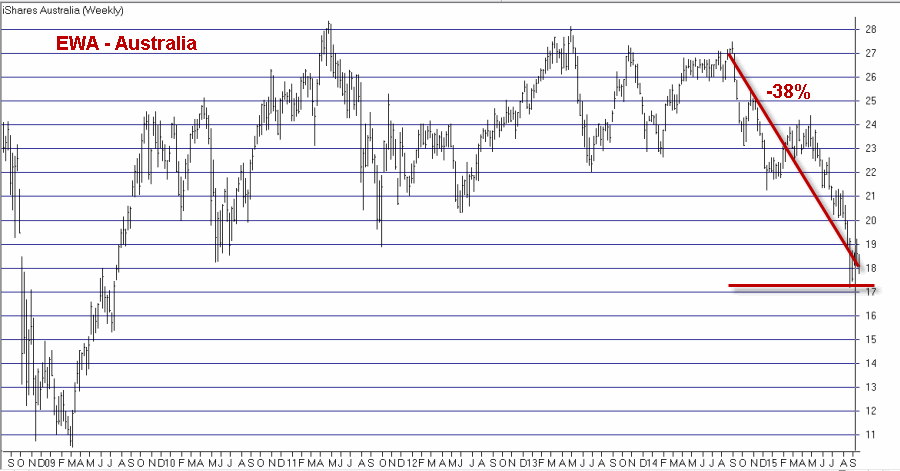
B) They have each a very tenuous “line in the sand” just below current levels.

1ewaFigure 1 – Australia (EWA) (Courtesy: AIQ TradingExpert)

1ewcFigure 2 – Canada (Ticker EWC) (Courtesy: AIQ TradingExpert)

1efaFigure 3 – MSCI EAFE (ticker EFA) (Courtesy: AIQ TradingExpert)

1ewgFigure 4 – Germany (Ticker EWG)(Courtesy: AIQ TradingExpert)

1ewmFigure 5 – Malaysia (Ticker EWM) (Courtesy: AIQ TradingExpert)

1ewsFigure 6 – Singapore (Ticker EWS) (Courtesy: AIQ TradingExpert)

1ewuFigure 7 – United Kingdom (Ticker EWU) (Courtesy: AIQ TradingExpert)

1ewzFigure 8 – Brazil (Ticker EWZ) (Courtesy: AIQ TradingExpert)

1idxFigure 9 – Indonesia (Ticker IDX) (Courtesy: AIQ TradingExpert)

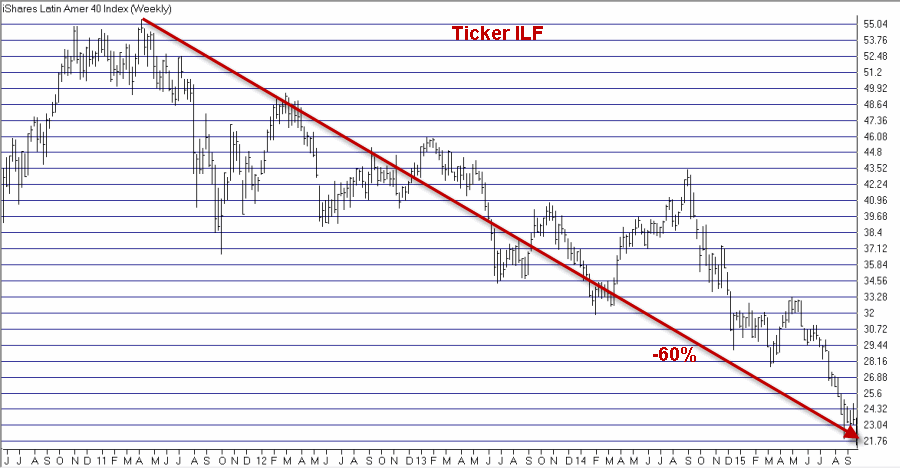
1ilfFigure 10 – Latin America (Ticker ILF) (Courtesy: AIQ TradingExpert)

Summary

I am not too good at “predicting” things so I will not offer an opinion as to what happens next.  The key point I am trying to make here is that we have arrived (in my opinion) at a “critical juncture”.  Either:

A) These major market averages will hold at or above their recent lows and a meaningful rally can ensue,

OR

B) These major market averages will break below their recent lows and then stage a quick reversal, which would likely lead to a meaningful rally

OR

C) These major market average will break down below the red lines drawn on Figures 1 through and things are going to get a whole lot uglier.

So now – i.e., the days and weeks just ahead – is an important time to keep your eye on the, um, balls (?)

Jay Kaeppel

Fighting the Urge to Jump into Gold Stocks (For Now)

Gold just experienced a nice “pop” to the upside, advancing $20 an ounce on 9/24.0Figure 1 – Is gold turning around?

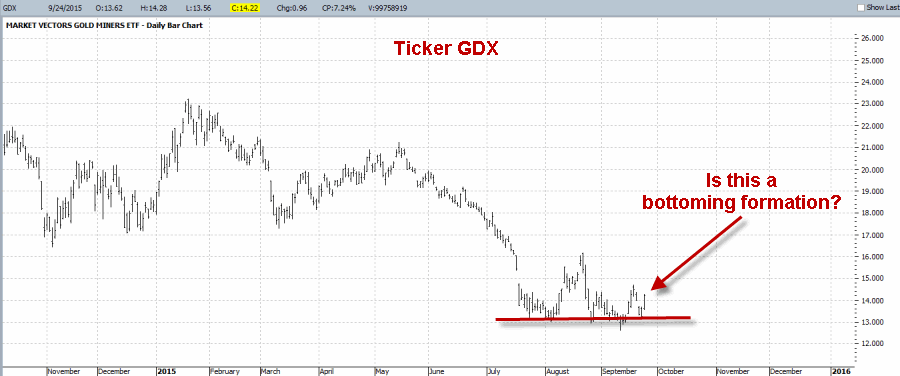
In addition, as you can see in Figure 2, it is possible to argue that gold stocks (using ETF ticker GDX as a proxy) are attempting to form some sort of a “multiple bottom”.0aFigure 2 – Are gold stocks forming a bottom?

Although I agree that there is much wisdom in the “never try to pick a bottom” line of reasoning, the truth is that as an option trader I have no problem with the idea of entering a limited dollar risk trade in hopes of catching a quick windfall if price reverses sharply.

So given the apparent reversal in gold bullion and the potential bottoming action in gold stocks (and the fact that I have always sort of had a “thing” for gold stocks – “Hi, my name is Jay and I am a volatility junkie”, but I digress) I am drawn to the long side of gold stocks.

But for now I am fighting the urge to act.

GDX under the Microscope – Technical

At the moment there are two concerns that are keeping me out of gold stocks – one technical and one seasonal.  In Figure 3 you can see that in the software that I use for Elliott Wave analysis (ProfitSource by HUBB), the daily Elliott Wave count for GDX is still projecting lower prices.2Figure 3 – Daily Elliott Wave count for GDX still pointing lower (Courtesy: ProfitSource by HUBB)

Now the truth is that Elliott Wave counts are a lot like a lot of other technical tools – i.e., there are great when they work.  So I only give a certain amount of weight to any Elliott Wave projection.  Also note this important distinction – in this case I am using Elliott Wave as weight of the evidence to keep me “out” of something and to avoid risking hard earned money on a speculative, counter-trend trade.  That is a far different situation than if I decided to use this particular wave count to actually enter a bearish position in GDX.

GDX under the Microscope – Seasonal

Another reason I am holding off on GDX is the fact that the bulk of October has often been quite unfavorable for gold stocks.  Figure 4 displays the growth of $1,000 invested in Fidelity Select Sector Gold (ticker FSAGX) only from the end of September through October Trading Day #19 every year since 1988.3Figure 4 – Growth of $1,000 invested in FSAGX from end of September through October Trading Day #19 (1988-present)

For the record during this period FSAGX:

*was UP 9 times (33% of the time)

*was DOWN 18 times (67% of the time)

*average UP period = +6.1%

*average DOWN period = (-9.6%)

*Net %+(-) = -76.6%

*# times UP was > +5% = 3

*# times DOWN was < -5% = 12

The bottom line is that early October is very often NOT a great time to be playing the long side of gold stocks.

So please also note that I am not “predicting” anything here – I am simply making a trading decision (or more accurately, a decision NOT to trade) based on the best information I have.

Summary

The “speculative fool” in me is crying out to take some sort of long position in gold stocks.  But the pragmatist in me looks at Figures 1 and 2 and says “there’ll be another opportunity coming along soon enough.”

That guy is just no darn fun at all.

Jay Kaeppel

The Heart of the Problem in Two Charts

First off, let me state that I must give all credit for this article to Gary Gordon who wrote an article titled “13 Economic Charts That Wall Street Doesn’t Want You to See”.

I suggest you read his article in its entirety.

But for my own purposes, I just want to highlight two of the charts in Gordon’s article because I think they represent…

The Heart of the Problem

I don’t suppose this will shock anyone but (in my opinion) the heart of any and all economic problems in America today is the fact that there simply not enough people working.  Period. End of story.  OK, at least in my opinion.

Figure 1 displays the Labor Participation Rate which has been trending steadily lower since the economic peak in 1999.1

Figure 1 – U.S. Labor Participation Rate

Gordon said it best in his article – “94 million potential workers are no longer contributing to the growth of the U.S. economy.”  Think about it – if people are not working they are either:

A) Starving

B) Living off of government largesse (i.e., the taxpayers)

Even more disturbing is Figure 2 which shows the “Inactivity Rate for people in the U.S. age 25-54” – in other words, people who are in their prime earning years.2

Figure 2 – Inactivity Rate for people Age 25-54

As Gordon points out correctly  in his article, this tells us that the declining participation rate shown in Figure 1 is NOT simply a matter of Baby Boomers retiring.

When people who should be at the height of their productiveness are “inactive”, well, all kidding aside. that is a profoundly sad thing.

Summary

Until we (“we” being our government and business, ahem, “leaders”) unleash economic forces that lead to greater job creation, the U.S. economy will continue to chug along at the very best.

And I am sure that whenever they get done doing whatever it is they are doing now, they will get right on this…..

Have a nice day.

Jay Kaeppel

Hoping for the Best (Preparing for the Worst) Part II

This article picks up where this article left off.  Now let’s look at one example way to “prepare for the worst”.

QQQ Out-of-the-Money Directional Butterfly

Now in all candor I find that when I use phrases like “QQQ Out-of-the-Money Directional Butterfly” a fair number of people either stop reading right away or at least tart to “drift off” in terms of concentration.  So for the benefit of those readers let me just say DO NOT STOP READING!!!

The only way to learn to be a better trader and investor is to consider new ideas that maybe don’t initially fit into your “comfort zone.”  That does not mean that you have to accept and utilize every new idea you come across. In fact, if you already have a pretty good approach to the markets then most news ideas “should” ultimately be discarded.  But closing your mind to new trading ideas is a surefire way to, er, “stunt your growth” as a trader.

So here goes:

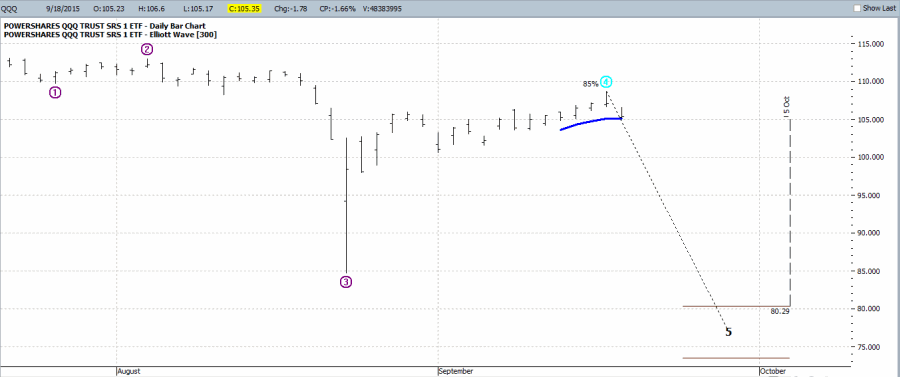
As you can see in Figure 1, the Elliott Wave count for QQQ is signaling the potential for a very sharp decline and soon. aFigure 1 – Elliott Wave count for QQQ projecting lower (Courtesy: Profitource by HUBB)

Here is something important to remember: Just because a piece of software that you use regularly “projects” something, it does not necessarily mean that it will happen.

So here are the important questions regarding the QQQ Elliott Wave projection shown in Figure 5:

Question #1) do you think there is a possibility that QQQ will sell off in the near term?

Question #2)How confident are you that it will fall as far as the projection is, well, projecting (i.e., down to the 73.50 – 80.29 price range)?

Question #3) How much are you willing to risk to hedge against whatever your downside expectations might be?

If by chance your answers to these questions are:

#1) Yes

#2) Maybe, maybe not

#3) Not a whole lot

Then the example trade below may be to interest to you.  This trade involves:

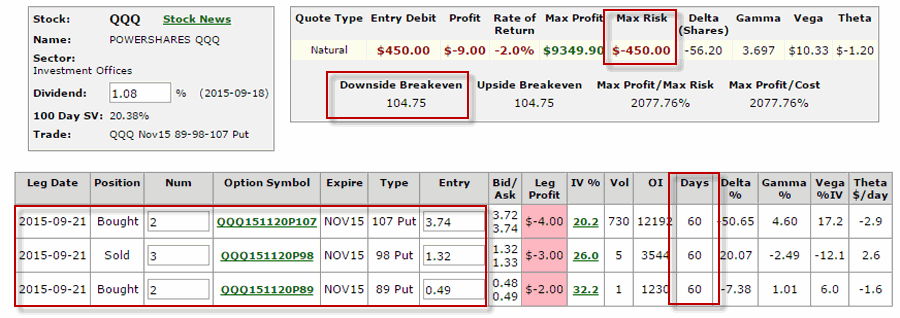
*Buying 2 QQQ November 107 puts

*Selling 3 QQQ November 98 puts

*Buying 2 QQQ November 89 puts

The cost of this trade (to buy one 2x3x2 position) is (or at least, was) $450.

bFigure 2 – QQQ OTM Put Butterfly  (Courtesy www.OptionsAnalysis.com)

As you can see in Figure 2:

*The cost to enter and the maximum risk on this trade is $450

*There are 60 days left until November expiration

*The breakeven price is 104.75 for QQQ (trading at 106.50 as this is written)

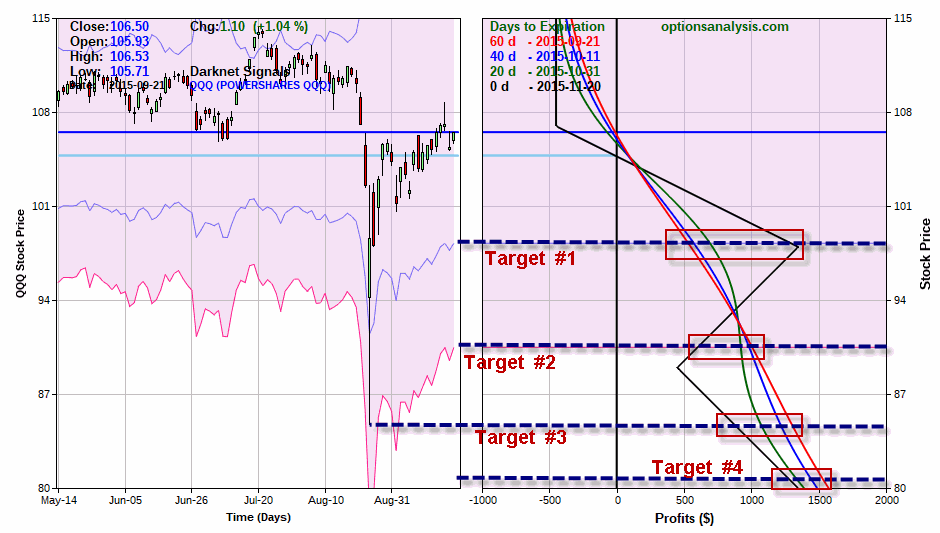
Figure 3 displays the risk curves for this trade.  It also lists four potential price targets as follows:

Target #1: A one standard deviation price decline

Target #2: A 2 standard deviation price decline

Target #3: A retest of the recent low

Target #4: The upper boundary of the Elliott Wave price range projection shown in Figure 1 ($80.29)

Each colored line in the clip on the right hand side of Figure 3 represents the expected $ profit or loss ($ values listed at bottom of right hand clip) for this trade based on:

A) a given price for QQQ (listed on the left-side axis)

B) a given date (dates listed in upper left hand corner of right clip in Figure 3 under “Day to Expiration”)

c1Figure 3 – QQQ Risk curves and potentia price targets (Courtesy www.OptionsAnalysis.com)

As you can see in Figure 3:

*The worst case scenario for this trade is that you hold it until November option expiration, QQQ is above 107 and the trade loses 100% (100% in this case = $450)

*You can see the profit potential for the trade at each target level in Figure 3.

Summary

As always, this is NOT a “recommendation”, only an “example”.  The key points to take away are these:

*The stock market “may” be setting up for a retest (or worse) of recent lows (of course then again, it may not)

*If a trader fears that this is a strong possibility, the trade highlighted here sees as an example of one way to “risk a little” in order to “hedge a lot”.

Jay Kaeppel