In this article I wrote about a signal called “Bull Market Thrust”. The upshot is that since 1991 it has identified 8 “bullish periods”. The start and end dates of those periods – and the price performance of several indexes during each period – appear in Figure 1.

Figure 1 – “Bull Market Thrust” bullish periods
One key thing to note is that – focusing solely on the Nasdaq 100 Index – 100% of the “bullish periods” witnessed a gain, i.e., “perfection.” The average gain was +40%.
So that looks pretty good and pretty darned encouraging going forward since there was a new buy signal on June 8th of this year. And indeed, if history is a guide the outlook for the Nasdaq (and the stock market as a whole) is favorable in the next year. But there is one thing to keep in mind….
Jay’s Trading Maxim #33: When you have actual money on the line, the chasm between theory and reality can be a mile wide.
The bottom line is that even during “bullish periods” the market fluctuates. And if one is focused on “news” there is plenty of opportunity to feel angst no matter how strong the market “should be.” So, in an effort to “mange expectations”, the charts below display the price action of the Nasdaq 100 during each “bullish period” displayed in Figure 1.
Nasdaq 100 during “Bullish Periods” based on Bull Market Thrust signals
*All charts below are (Courtesy AIQ TradingExpert)
*Each chart displays one of the “Bullish Periods” from Figure 1.
*Each chart contains one or more red boxes highlighting a period of “market trouble”
THE POINT: the key thing to ponder is how easily it would be to allow yourself to get “shaken out” if you were focused on what the “news of the day” is telling you, rather than what the market itself is telling you.
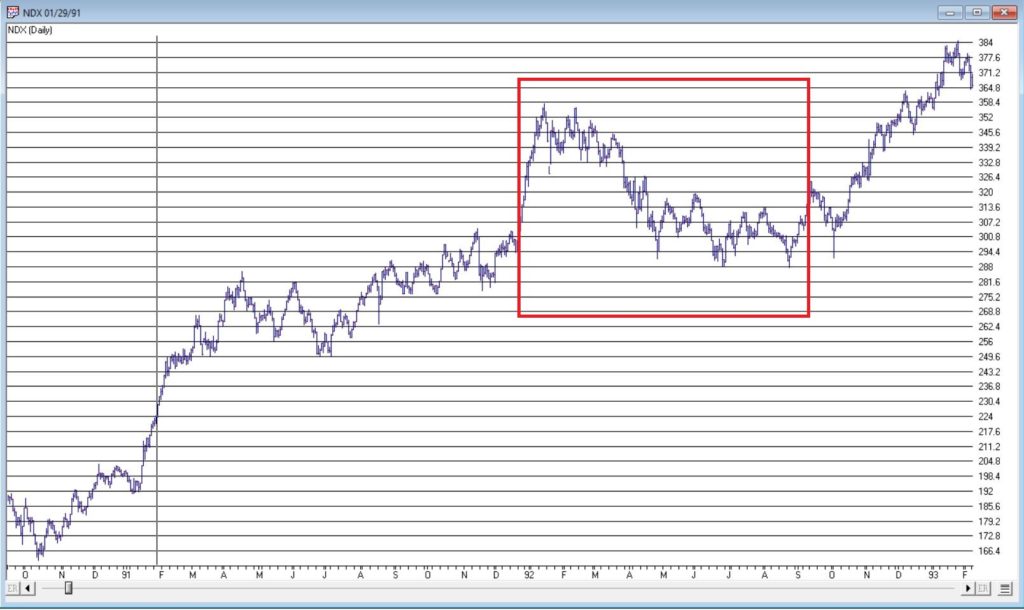
Figure 2 – NDX: 1/29/91 – 2/28/93
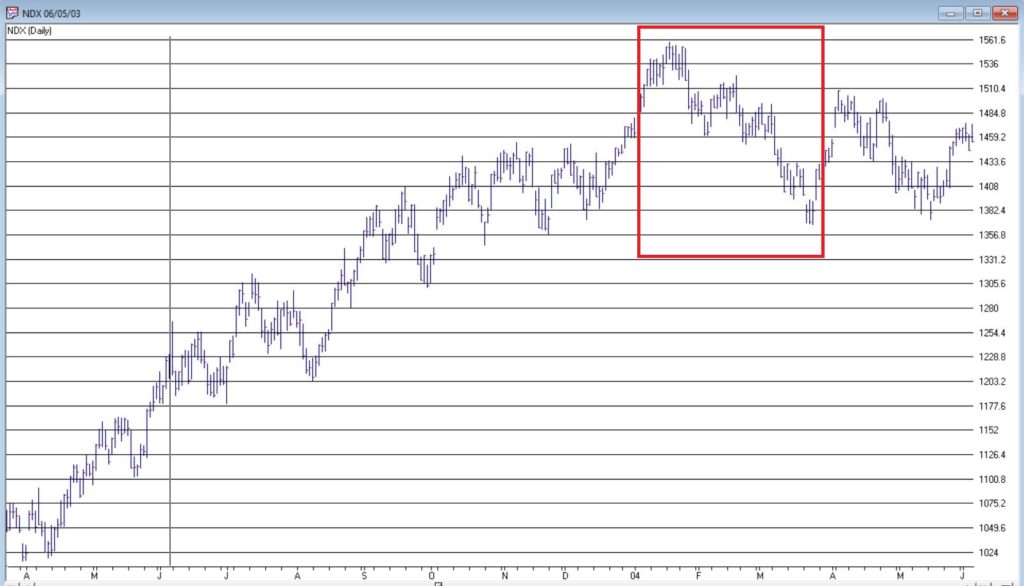
Figure 3 – NDX: 6/5/2003-6/4/2004
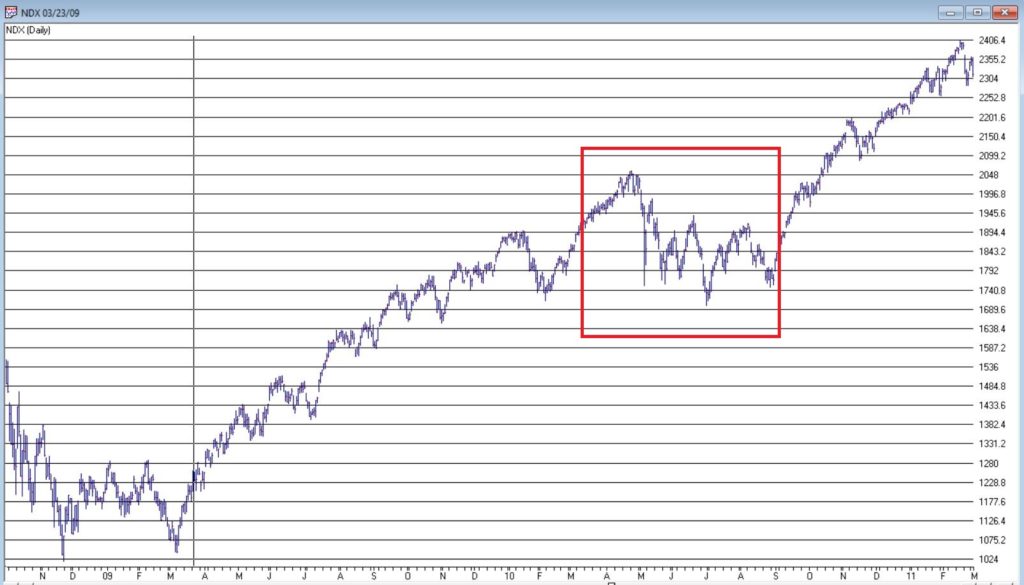
Figure 4 – NDX: 3/23/2009-3/1/2011
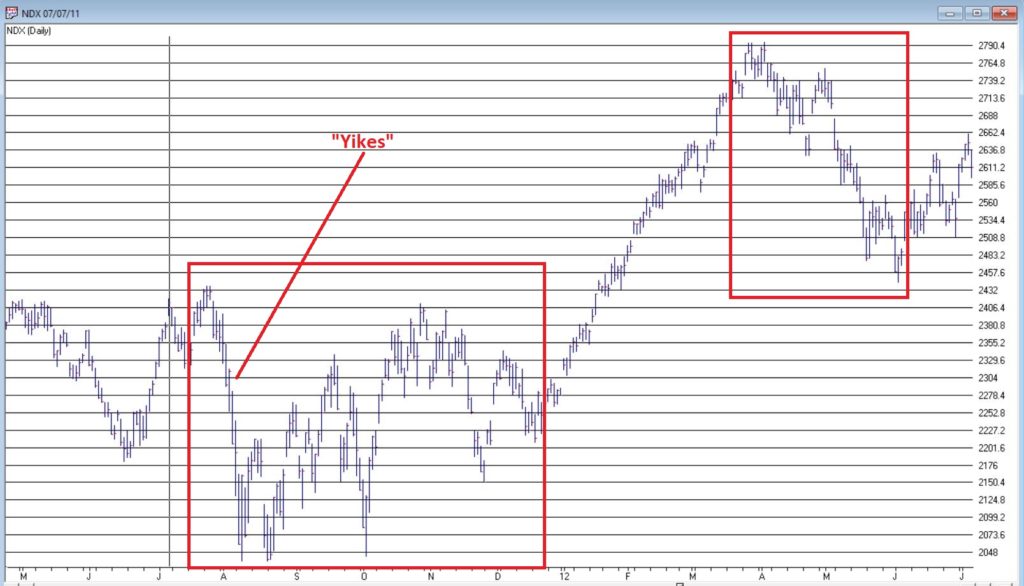
Figure 5 – NDX: 7/7/2011-7/6/2012
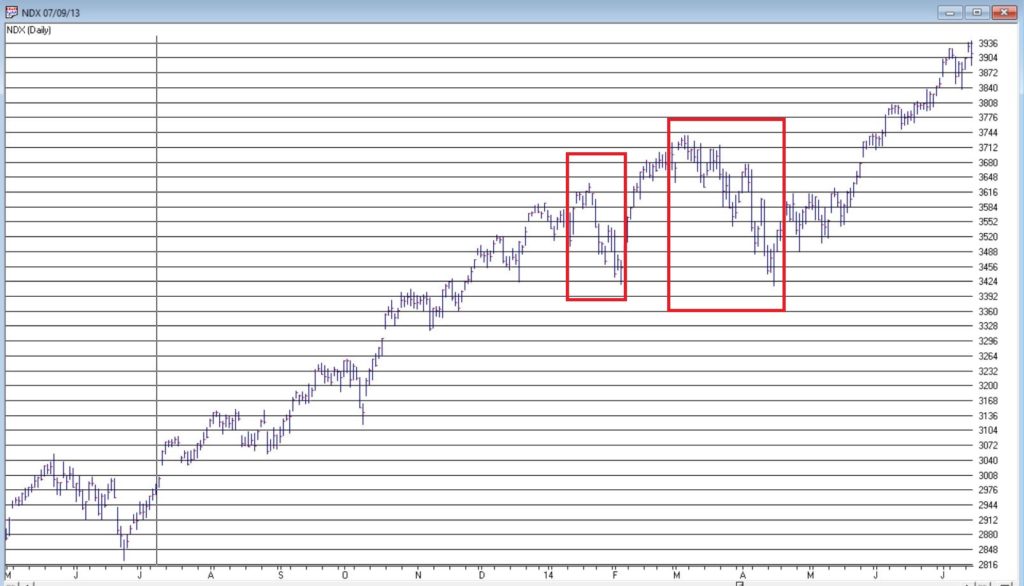
Figure 6 – NDX: 7/9/13-7/15/2014
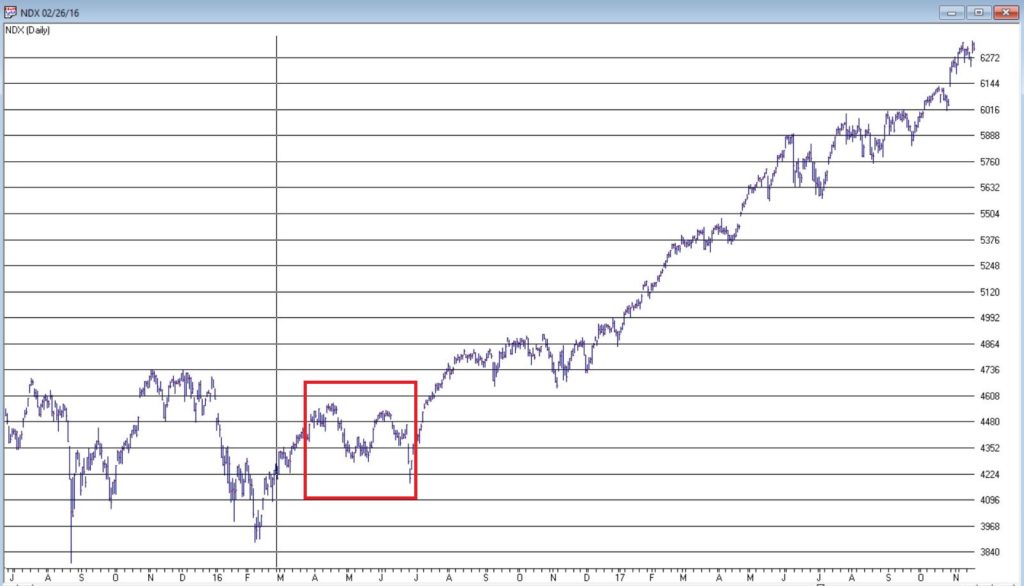
Figure 7 – NDX: 2/26/2016-11/17/2017
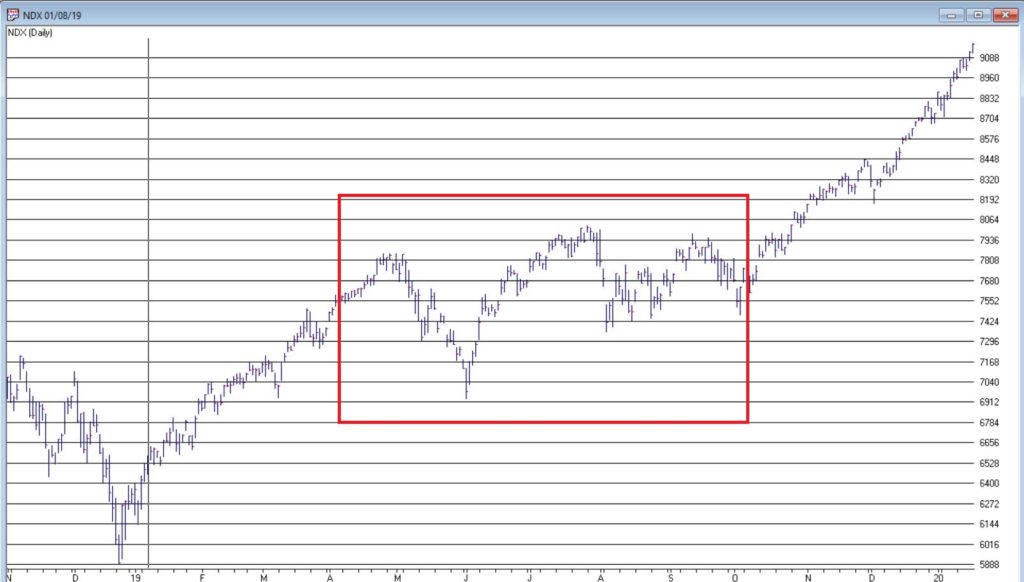
Figure 8 – NDX: 1/8/2019-1/17/2020
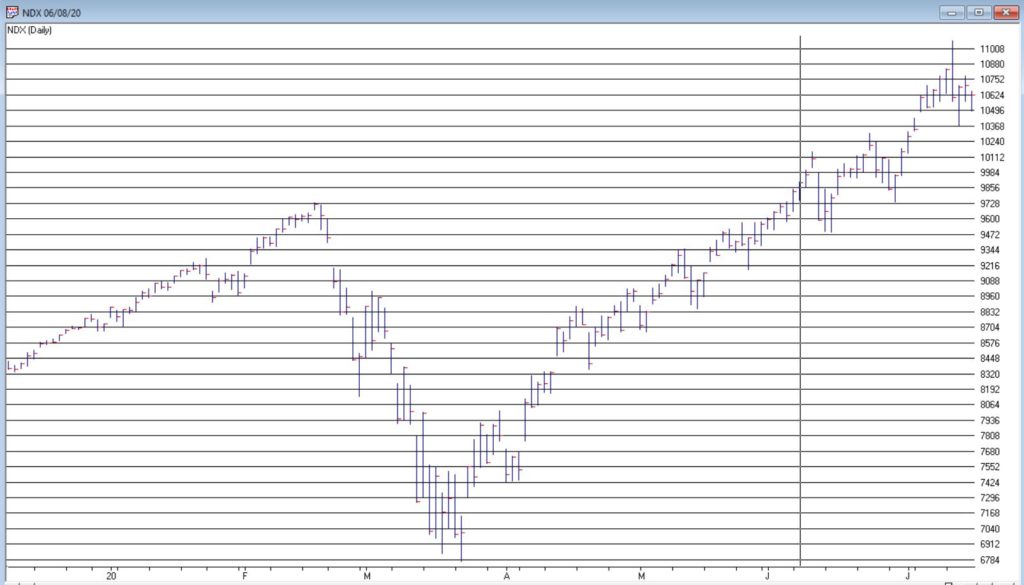
Figure 9 – 6/8/2020-?
The bottom line is that:
*Sometimes the market “took off” after the signal
*Sometime the market sold off shortly after the signal (see 2011 signal)
*In every case there was a drawdown of some significant somewhere along the way
The purpose of paying attention to things like “Bull Market Thrust” buy signals is not to “pick bottoms with uncanny accuracy.”
In the real word, the purpose is to help strengthen our resolve in riding the exceptional opportunities.
See also Jay Kaeppel Interview in July 2020 issue of Technical Analysis of Stocks and Commodities magazine
See also Jay’s “A Strategy You Probably Haven’t Considered” Video
See also Video – The Long-Term…Now More Important Than Ever
Jay Kaeppel
Disclaimer: The information, opinions and ideas expressed herein are for informational and educational purposes only and are based on research conducted and presented solely by the author. The information presented represents the views of the author only and does not constitute a complete description of any investment service. In addition, nothing presented herein should be construed as investment advice, as an advertisement or offering of investment advisory services, or as an offer to sell or a solicitation to buy any security. The data presented herein were obtained from various third-party sources. While the data is believed to be reliable, no representation is made as to, and no responsibility, warranty or liability is accepted for the accuracy or completeness of such information. International investments are subject to additional risks such as currency fluctuations, political instability and the potential for illiquid markets. Past performance is no guarantee of future results. There is risk of loss in all trading. Back tested performance does not represent actual performance and should not be interpreted as an indication of such performance. Also, back tested performance results have certain inherent limitations and differs from actual performance because it is achieved with the benefit of hindsight.


July 15th you published Part I of this “thrust” phenomenon. When I compare that data with today’s I’m confused. They report different occurrences of thrust. Explain, please?
James, Figure 1 in the 7/17 article is the same as Figure 3 in the 7/15 article. These dates mark the beginning of a new bullish period through 252 trading days later OR 252 trading days after any subsequent signals within 252 days of the date in the left hand column. Figure 1 in the 7/15 article lists ALL bullish thrust signals regardless of overlaps. Hope that helps. Jay