This post stems entirely from a tweet from Mark Ungewitter. Mark is a Senior Vice President & Investment Officer at Charter Trust Company and has a very interesting twitter feed.
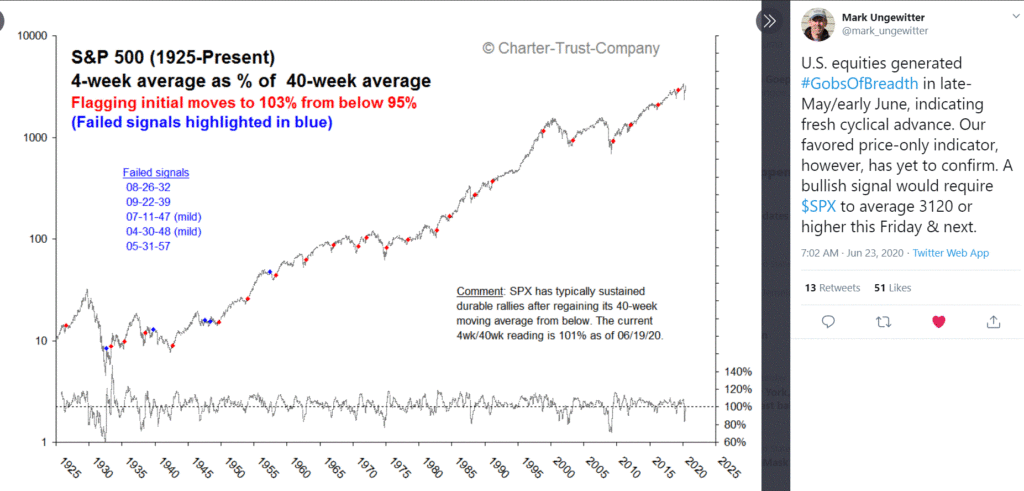
He recently posted the shot you see in Figure 1.

Figure 1 – Mark Ungewitter tweet regarding S&P 500 4-week and 40-week averages (Courtesy: www.Twitter.com)
The calculation is pretty straightforward:
A = 4-week average of S&P 500 closes
B = 40-week average of S&P 500 closes
C = A / B
What I will heretofore refer to as an “MU Buy Signal” occurs when the following two steps are completed:
*The ratio (Value C above) falls to 0.95 or below
*The ratio (Value C above) subsequently rises to 1.03 or above
In slightly clearer terms, when the 4-week average drops 5% or more below the 40-week average it indicates an oversold market and sets the stage for the next bull market. The new bull market is confirmed (at least in most cases) when the 4-week average subsequently rises 3% or more above the 40-week average.
Results
Is there any real value in this calculation? You be the judge. Let’s consider the average 4, 13, 26, 39 and 52 week returns following such buy signals versus the average return for all 4, 13, 26, 39- and 52-week periods.
To understand, the right-hand column in row two of Figure 2 tells us the historical average 4-week return for the S&P 500 Index is +0.5%. However, as you can see in the second column in row two, the average 4-week return following MU Buy Signals is +2.3%.
The key thing to note is that across all time frames the average S&P 500 return after a MU buy signal are significantly higher than the typical return for that period.

Figure 2 – S&P 500 returns after MU Buy Signals versus all weeks
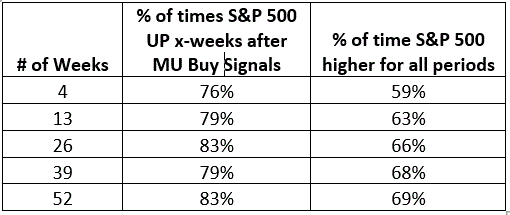
Consistency – more specifically defined as “probability of profit” – is also important. Figure 3 displays the typical percent of time the S&P 500 moves higher over 4, 13, 26, 39 and 52-week period in the far-right hand column.
Note again that for each time period the “% of times UP” is significantly higher following a MU Buy signal.

Figure 3 – % time S&P 500 higher x-weeks after MU Buy Signals
To illustrate one last highlight of consistency, Figure 4 displays the cumulative % price return for the S&P 500 Index if held ONLY during the 39-weeks after each MU Buy Signal since 1932.

Figure 4 – Cumulative % +(-) if S&P 500 Index is held for 39-weeks after each MU Buy Signal
For the record, since 1958 17 of the last 18 MU Buy Signals have seen the S&P 500 Index rise in the 39-weeks following the signal.
Summary
Looks like something worth following to me. Thanks Mark.
See also Jay Kaeppel Interview in July 2020 issue of Technical Analysis of Stocks and Commodities magazine
See also Jay’s “A Strategy You Probably Haven’t Considered” Video
See also Video – The Long-Term…Now More Important Than Ever
Figure 5 below displays the S&P performance following previous MU Buy Signals. IMPORTANT DISCLAIMER: The data in Figure 5 is generated using my own set of price data which is believed to be accurate. It is possible Mark Ungewitter could generate slightly different results.

Figure 5 – MU Buy Signals (as generated by Jay’s database) and S&P 500 Performance
Jay Kaeppel
Disclaimer: The information, opinions and ideas expressed herein are for informational and educational purposes only and are based on research conducted and presented solely by the author. The information presented represents the views of the author only and does not constitute a complete description of any investment service. In addition, nothing presented herein should be construed as investment advice, as an advertisement or offering of investment advisory services, or as an offer to sell or a solicitation to buy any security. The data presented herein were obtained from various third-party sources. While the data is believed to be reliable, no representation is made as to, and no responsibility, warranty or liability is accepted for the accuracy or completeness of such information. International investments are subject to additional risks such as currency fluctuations, political instability and the potential for illiquid markets. Past performance is no guarantee of future results. There is risk of loss in all trading. Back tested performance does not represent actual performance and should not be interpreted as an indication of such performance. Also, back tested performance results have certain inherent limitations and differs from actual performance because it is achieved with the benefit of hindsight.

