In case you were not aware, I am something of a seasonality “junkie”. Hey, if you gotta have a vice…
Anyway, as it turns out many individual months have a “personality” of their own. Take July for instance.
July, Interrupted
We will break July into two parts:
*Part 1 includes:
-Trading days #1 through 13 (i.e., the first 13 trading days of the month, i.e., excludes holidays and weekends and includes only actual trading days when the market is open) AND
-Trading days #17 through #21.
*Part 2 includes:
-ALL other trading days of July (i.e., trading days #14 through 16 and anything after trading day #21)
Figure 1 displays the cumulative growth for the Dow Jones Industrial Average during all Part 1 days ONLY starting in 1936.
Figure 1 – Cumulative Dow price % +(-) during July Favorable Days (1936-2019)
Figure 2 displays the cumulative growth for the Dow Jones Industrial Average during all Part 2 days ONLY starting in 1936.
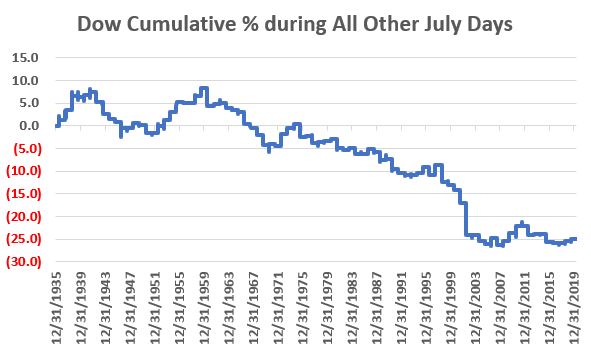
Figure 2 – Cumulative Dow price % +(-) during July Non-Favorable Days (1936-2019)
In a nutshell:
Figure 3 – Summary of Performance for July Favorable versus Non-Favorable Trading Days (1936-2019)
For 2020, the first favorable period includes July 1 through July 20 and the 2nd includes July 24 through July 30.
Is it worth it to trade in and out during the month of July? That’s up to you to decide. But for what it’s worth, here are the numbers.
See also Jay Kaeppel Interview in July 2020 issue of Technical Analysis of Stocks and Commodities magazine
See also Jay’s “A Strategy You Probably Haven’t Considered” Video
See also Video – The Long-Term…Now More Important Than Ever
Jay Kaeppel
Disclaimer: The information, opinions and ideas expressed herein are for informational and educational purposes only and are based on research conducted and presented solely by the author. The information presented represents the views of the author only and does not constitute a complete description of any investment service. In addition, nothing presented herein should be construed as investment advice, as an advertisement or offering of investment advisory services, or as an offer to sell or a solicitation to buy any security. The data presented herein were obtained from various third-party sources. While the data is believed to be reliable, no representation is made as to, and no responsibility, warranty or liability is accepted for the accuracy or completeness of such information. International investments are subject to additional risks such as currency fluctuations, political instability and the potential for illiquid markets. Past performance is no guarantee of future results. There is risk of loss in all trading. Back tested performance does not represent actual performance and should not be interpreted as an indication of such performance. Also, back tested performance results have certain inherent limitations and differs from actual performance because it is achieved with the benefit of hindsight.

