The most well-worn phrase in all of investing is “The Trend is Your Friend”. And yes, trends are great. Well, at least for as long as they last. Unfortunately, when a given trend ends things can get pretty dicey for a while. Unbeknownst to a lot of investors there are a variety of very strong trends in place right now. That’s the good news. The bad news is that many strong trends appear to be reaching the “overdone” phase. The tricky part here is understanding that this proclamation is NOT a “call to action.” It is more of a “call to pay close attention.” Some investors have the patience for that, but likely the majority do not. Here’s hoping that you are not one of former.
Measuring a Trend
For a variety of assets, here are the steps we will use to follow the “trend.”
A = Cumulative growth of $1,000 for Asset A using monthly total return data
B = Cumulative growth of $1,000 for Asset B using monthly total return data
C = A / B (i.e. the ratio of $1,000 investment in both assets)
D = 15-month exponential moving average of C (more on this calc below)
E = (C – D)
By looking at E when can get a handle on when a given trend may have “gone too far”
*15-month exponential average = (last month value for D * 0.875) + (this month’s value for C * 0.125)
Trend #1. Nasdaq versus MSCI EAFE Index
For the Nasdaq we use the Nasdaq Composite from January 1976 through March 1996 and then the Nasdaq 100 Index from April 1996 through April 2000. The MSCI EAFE Index is a broad international index of over 900 companies from a variety of developed countries excluding the US and Canada.
The blue line in Figure 1 displays Variable C (the growth of $1,000 invested in Nasdaq stocks divided by $1,000 invested in international stocks). The orange line is the 15-month exponential average. When the blue line is rising it means Nasdaq stocks are outperforming international stocks and vice versa.
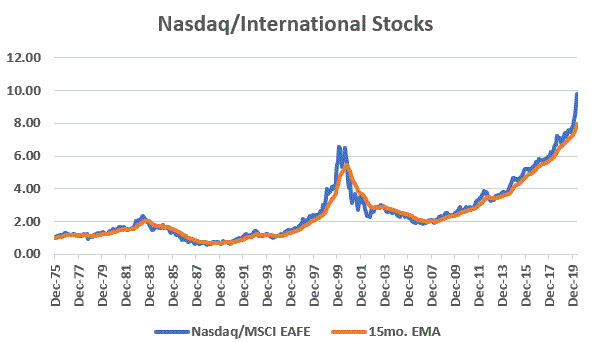
Figure 1 – Nasdaq / EAFE with 15-month exponential average
There are two things to take away from Figure 1:
*Nasdaq stocks have been outperforming EAFE stocks for quite awhile and by an ever increasing margin of late.
*The ratio has gone parabolic. The last time this happened was 1999-2000 before the dot com bubble burst.
*The implications: On a trend-following basis Nasdaq has been and remains the place to be. However, when this relationship changes (and rest assured it WILL change at some point), Nasdaq stocks will almost certainly NOT be the place to be.
Figure 2 displays value E from above (the difference between the two lines in Figure 1).
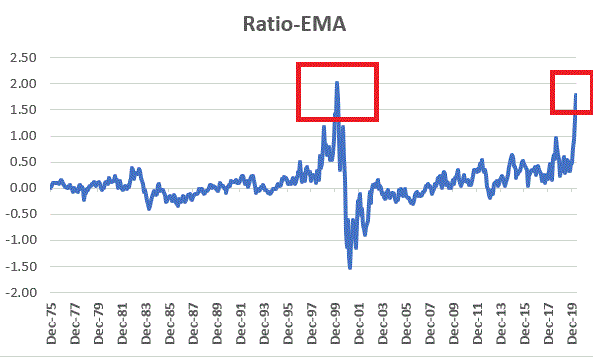
Figure 2 – Nasdaq/EAFE Ratio minus 15-month EMA
Figure 2 essentially serves as a warning sign that enthusiasm for Nasdaq stocks may be reaching a crescendo.
Trend #2. Large-Cap Growth versus Small-Cap Value
Large-caps and growth stocks are quite popular at the moment. Small-cap stocks and especially value stocks have not been for some time. For large-cap growth we use the Russell 1000 Growth Index and for small-cap value we use the Russell 2000 Value index. Our test period for this pair is from January 1979 through April 2020.
The blue line in Figure 3 displays Variable C (the growth of $1,000 invested in large-cap growth stocks divided by $1,000 invested in small-cap value stocks).
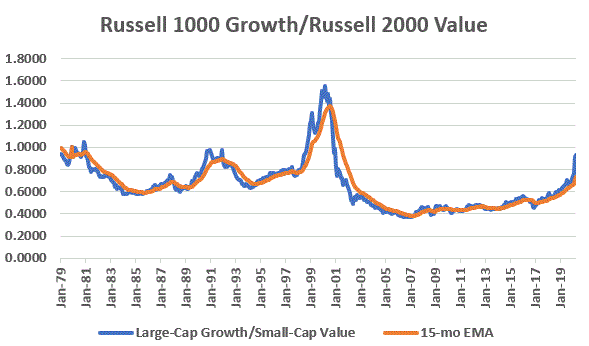
Figure 3 – Russell 1000 Growth / Russell 2000 Value with 15-month exponential average
Figure 4 displays Value E from above (the difference between the two lines in Figure 3)
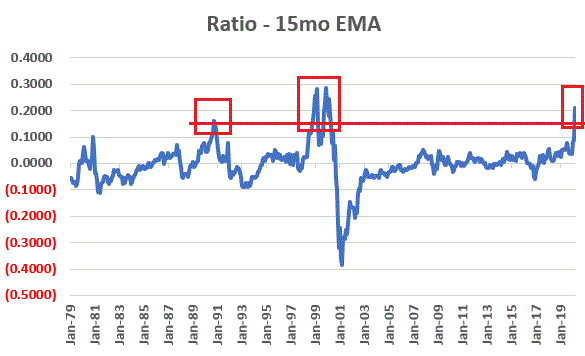
Figure 4 – Russell 1000 Growth/Russell 2000 Value Ratio minus 15-month EMA
There are two things to take away from Figures 3 and 4:
*In Figure 3 we can see that the absolute ratio has risen to higher levels in the past, so further outperformance for large-cap growth is possible;
*In Figure 4 we see the potentially “overdone” nature of the relationship.
*The implications: On a trend-following basis large-cap growth has been and remains the place to be relative to small-cap growth. However, when this relationship changes, investors should watch closely for a resurgence of small-cap value stocks
Trend #3. Stocks versus Commodities
In the long disinflationary period that we have enjoyed, commodities have become the real “dogs” of the investment world.
The blue line in Figure 5 displays Variable C (the growth of $1,000 invested in the S&P 500 Index divided by $1,000 invested in the Goldman Sachs Commodity Index, or GSCI) from January 1972 through April 2020.
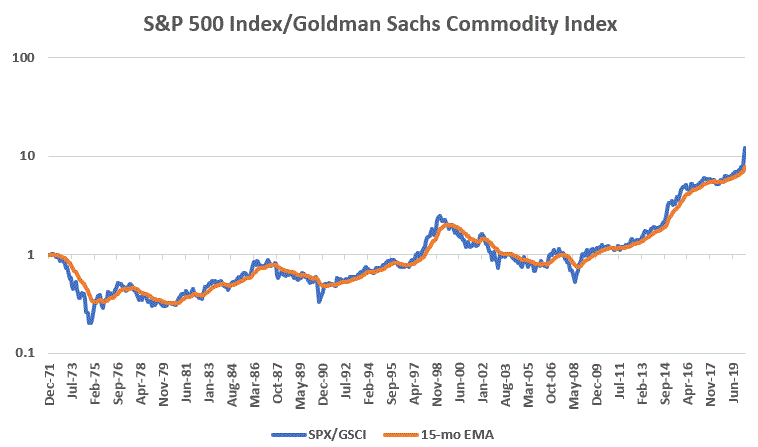
Figure 5 – S&P 500 Index / Goldman Sachs Commodity Index with 15-month exponential average
To fully appreciate the information conveyed in Figure 5 consider this: an investment in stocks has grown over 10 ten times as much as an investment in commodities over the past 48 years (and 22 times as much since June 2008!).
Figure 6 displays displays Value E from above (the difference between the two lines in Figure 5).
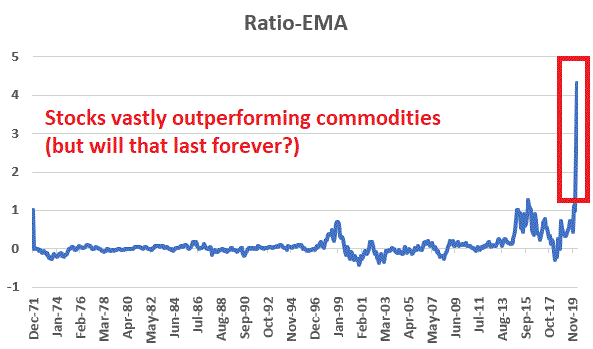
Figure 6 – S&P 500 / Goldman Sach Commodity Index Ratio minus 15-month EMA
To better appreciate the disparity between the performance of stocks and commodities consider the charts in Figure 7. The top clip is ticker SPY (and ETF that tracks the S&P 500 Index) and the bottom clip is ticker DBC (an ETF that tracks a basket of commodity futures). When this disparity will end is anyone’s guess – and I am not “predicting” that that change is necessarily imminent. But commodity prices are not going to “0”.
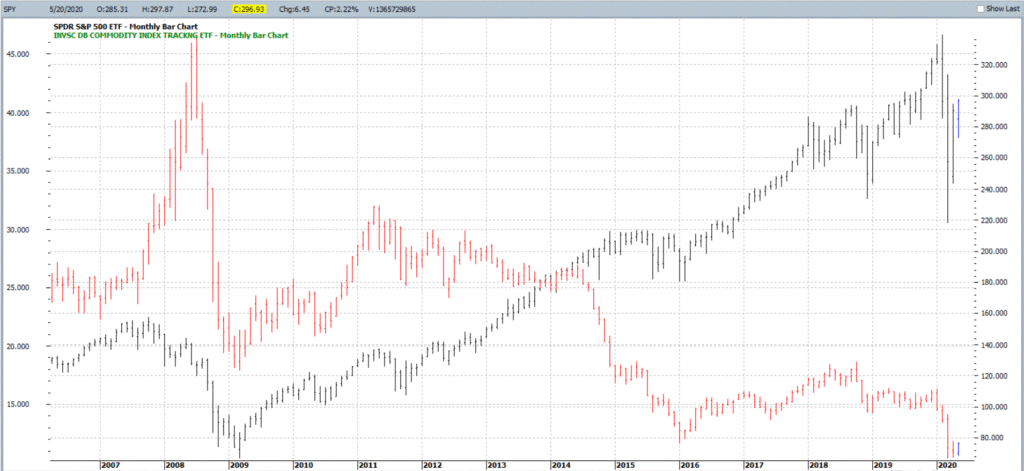
Figure 7 – Ticker SPY versus ticker DBC (Courtesy ProfitSource by HUBB)
The implications of Figures 5 through 7: Investors have been conditioned to love stocks and hate commodities for about 4 decades. But the reality is that “stocks are better than commodities” is NOT a permanent state of affairs, and alert investors should be watching closely for a reversal in favor of commodities. For the record, this may not occur for some time. HOWEVER, when it does occur commodities and NOT stocks will be the place to be.
Summary
Please understand what this piece is – and is NOT – trying to convey. The takeaway is NOT that you should sell U.S. large-cap growth stocks and pile into internationals, small-caps, value stocks or commodities.
At least not yet. Because these current trends could persist for quite some time and become even more extreme.
But the point is that given the cyclical nature of markets – and the recent extreme outperformance on the former versus the latter – simply remember that no trend lasts forever. I have no idea when the trends detailed above will change. But I am pretty confident that at some point they WILL change. And when they do, the investors who are prepared to “roll with the changes” will have a great opportunity to prosper. And the simple act of tracking and observing certain ratios over time can be very useful in identifying when those changes are starting to take place.
So put the relationships discussed in the back of your head. When they ultimately change, how you react may have a profound impact on your long-term investment results.
See also Jay’s “A Strategy You Probably Haven’t Considered” Video
See also Video – The Long-Term…Now More Important Than Ever
Jay Kaeppel
Disclaimer: The information, opinions and ideas expressed herein are for informational and educational purposes only and are based on research conducted and presented solely by the author. The information presented represents the views of the author only and does not constitute a complete description of any investment service. In addition, nothing presented herein should be construed as investment advice, as an advertisement or offering of investment advisory services, or as an offer to sell or a solicitation to buy any security. The data presented herein were obtained from various third-party sources. While the data is believed to be reliable, no representation is made as to, and no responsibility, warranty or liability is accepted for the accuracy or completeness of such information. International investments are subject to additional risks such as currency fluctuations, political instability and the potential for illiquid markets. Past performance is no guarantee of future results. There is risk of loss in all trading. Back tested performance does not represent actual performance and should not be interpreted as an indication of such performance. Also, back tested performance results have certain inherent limitations and differs from actual performance because it is achieved with the benefit of hindsight.


E = (C – E) ?? Shouldn’t it be E = (C –D)?
Yes, thanks for the catch. Fixed.
International and emerging has tended to outperform U.S. ( S&P 500 ), and vice versa, when 3 year annual rolling returns were “greater” than.
https://imgur.com/7ZeJaMU
For E do you mean (C-D)? Great stuff.