In this article I pointed out the fact that market analysis does not necessarily need to be complicated. With that theme in mind, this time out let’s highlight a simple way to combine the calendar with the trend to help assess the current level of risk in the market.
The Calendar/Trend Model
Let’s make it as simple as possible:
*If the current month is November through May add +2 to the Calendar/Trend Model
*If the S&P 500 is above it’s 200-day moving average add +1 to the Calendar/Trend Model
So, for any given day the Model can read 0, 1, 2 or 3.
3 = Both parts are bullish
2 = Calendar is bullish but trend is not
1 = Trend is bullish but calendar is not
0 = Both parts are bearish
Does any of this matter? Figure 1 displays the cumulative price performance for the S&P 500 Index starting November 1, 1949 depending on the Calendar/Trend Model reading for each day.

Figure 1 – S&P 500 Performance at different Calendar/Trend Model readings (1949-2020)
The differences in the right-hand column are fairly stark. The key things to note:
*The vast majority of gains are achieved when BOTH parts of the model are bullish
*The market actually lost money during those periods when both parts of the model are bearish
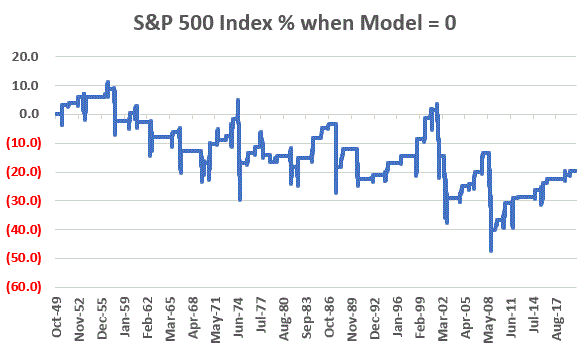
It should be noted however, that when the model = 0 it is NOT like the market is sure to decline. Figure 2 displays the growth of equity when the Calendar/Trend Model = 0. What we see are plenty of periods where the market gained ground and also periods when the market suffered significant declines.

Figure 2 – S&P 500 cumulative price % +(-) when Calendar/Trend Model = 0
So, the proper response to a 0 reading is NOT necessarily to “sell everything” and head for the hills. The proper response is to pay very close attention and to be prepared to act defensively at the first sign of serious trouble – because declines that occur when the model is 0 can be swift and severe.
Where We Are
*At the moment the Calendar/Trend Model stands at +2 as we are in the month of May BUT the S&P 500 Index is below its 200-day moving average
*On June 1 the calendar part of the model falls to 0
*Meanwhile the S&P 500 Index (as I write) is back within about 45 points of getting back above its 200-day moving average.
What to Watch For
If the S&P 500 Index fails to climb back above and holds above it’s 200-day moving average in the months ahead we will be in a 0-reading situation for the Calendar/Trend Model after May 31st. Does that mean the market will go down? Not necessarily.
But what it would mean is that if the S&P 500 Index remains below its 200-day moving average between June 1, 2020 and October 31, 2020 there is an elevated risk of downside activity and as a result, investors should have a heightened sense of caution.
See also Jay’s “A Strategy You Probably Haven’t Considered” Video
See also Video – The Long-Term…Now More Important Than Ever
Jay Kaeppel
Disclaimer: The information, opinions and ideas expressed herein are for informational and educational purposes only and are based on research conducted and presented solely by the author. The information presented represents the views of the author only and does not constitute a complete description of any investment service. In addition, nothing presented herein should be construed as investment advice, as an advertisement or offering of investment advisory services, or as an offer to sell or a solicitation to buy any security. The data presented herein were obtained from various third-party sources. While the data is believed to be reliable, no representation is made as to, and no responsibility, warranty or liability is accepted for the accuracy or completeness of such information. International investments are subject to additional risks such as currency fluctuations, political instability and the potential for illiquid markets. Past performance is no guarantee of future results. There is risk of loss in all trading. Back tested performance does not represent actual performance and should not be interpreted as an indication of such performance. Also, back tested performance results have certain inherent limitations and differs from actual performance because it is achieved with the benefit of hindsight.


What percentage of the time in the model in State 3?
Terry, excellent question: The breakdown is as follows:
0 12% of the time
1 30% of the time
2 17% of the time
3 41% of the time
I calculate that if one were only to be invested during State 3, the compound annual growth rate is 5.9%. What happens if you invest for 8 months, instead of 7 (November thru June)?
It’s clear to me that the risk adjusted return of State 3 is very good. But, this example does not exceed “Buy and Hold” rate of ~10%.
Donald, you raise an interesting point. A couple of things: Assuming a fully invested position when Model = 3 and out of the market completely when < 3 - Presumably if dividends were added in during the time in the market, and some rate of interest were added when out of the market, the annualized return would look more attractive. That being said, for the record I don't use nor advocate this as an independent investment "system". I use this as more of a "perspective" or "weight of the evidence" type of tool. In other words one would likely be more aggressive when the model is +3 then when the model is 0. Take Care, Jay
I want you to know that I really enjoyed the article. Thank you.