In this article I wrote about the performance of the stock market around market holidays. I refer to these days as “Happy Holiday Days”, and for good reason. Today we will bring a few things up to date.
The Happy Holiday Days
Much analysis has been done about trading days around market holidays. In some cases, the day before seems to perform best, in other cases it’s the day after the holiday, etc. While it is all very interesting (at least to a market geek such as myself), for our purposes we won’t try to cut it too finely. So, here is how we will define things:
Happy Holiday Days = the 3 trading days before AND the 3 trading days after each and every official U.S. stock market holiday
At present these include:
*Martin Luther King Day
*Presidents Day
*Easter
*Memorial Day
*Independence Day
*Labor Day
*Thanksgiving
*Christmas
*New Years
Nine holidays times 6 days apiece – but not exactly as there is always some overlap between Christmas and New Year’s. So, it’s usually somewhere between 50 and 52 holidays days per year, out of approximately 250-253 total trading days per year.
Since December 1933, 18.9% of all trading days have qualified as “Happy Holiday Days”. Now if the stock market were truly “efficient” we would expect the gains achieved during these holiday days to amount to roughly 19% of all stock market returns.
The Test
We start our test on 12/1/1933 and track the following:
*The growth of $1,000 invested in the Dow Jones Industrial Average ONLY during the 3 trading days before and the 3 trading days after each stock market holiday
*The growth of $1,000 invested in the Dow Jones Industrial Average ONLY during ALL OTHER trading days
The Results
The results appear in graphic form in Figure 1.

Figure 1 – Growth of $1,000 invested in Dow ONLY during Happy Holiday Days (blue line) versus all other trading days (red line); 1933-2019
As you can see in Figure 1, Happy Holiday Days clearly outperformed all other trading days combined.

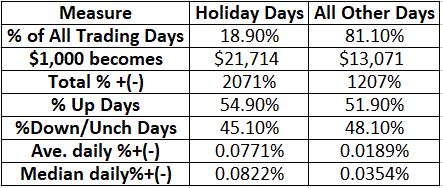
Figure 2 displays the relevant comparative figures.
Figure 2 – Happy Holiday Trading Days versus All Other Trading Days; 1933-2019
Not that the average holiday day gain (+0.0771%) is almost 4.1 time greater than the average non-holiday day gain (+0.0189%)
Summary
The lesson appears to be that in the long run it pays to be bullish around the holidays.
So once again the course of action is clear: Please join my annual Holiday Season Drive by contacting your elected representatives and demanding more holidays!
Jay Kaeppel
Disclaimer: The information, opinions and ideas expressed herein are for informational and educational purposes only and are based on research conducted and presented solely by the author. The information presented does not represent the views of the author only and does not constitute a complete description of any investment service. In addition, nothing presented herein should be construed as investment advice, as an advertisement or offering of investment advisory services, or as an offer to sell or a solicitation to buy any security. The data presented herein were obtained from various third-party sources. While the data is believed to be reliable, no representation is made as to, and no responsibility, warranty or liability is accepted for the accuracy or completeness of such information. International investments are subject to additional risks such as currency fluctuations, political instability and the potential for illiquid markets. Past performance is no guarantee of future results. There is risk of loss in all trading. Back tested performance does not represent actual performance and should not be interpreted as an indication of such performance. Also, back tested performance results have certain inherent limitations and differs from actual performance because it is achieved with the benefit of hindsight.

