The soybean market one of the most cyclical markets there is. This is in large part due to the planting and growing season (as explained here). This article is about a “seasonal/cyclical” speculative play using options on ticker SOYB.
There are two key caveats:
*The trade highlighted is NOT a “recommendation”, only an example of how to speculate on a potential move using options in order to achieve limited risk and unlimited profit potential.
*Options on ticker SOYB are very thinly traded. So, any investor who might choose to wade in needs to be aware that they may need to consider using a limit order in order to avoid significant slippage.
The Setup
Figure 1 displays the annual seasonal trend for soybeans according to www.sentimentrader.com.
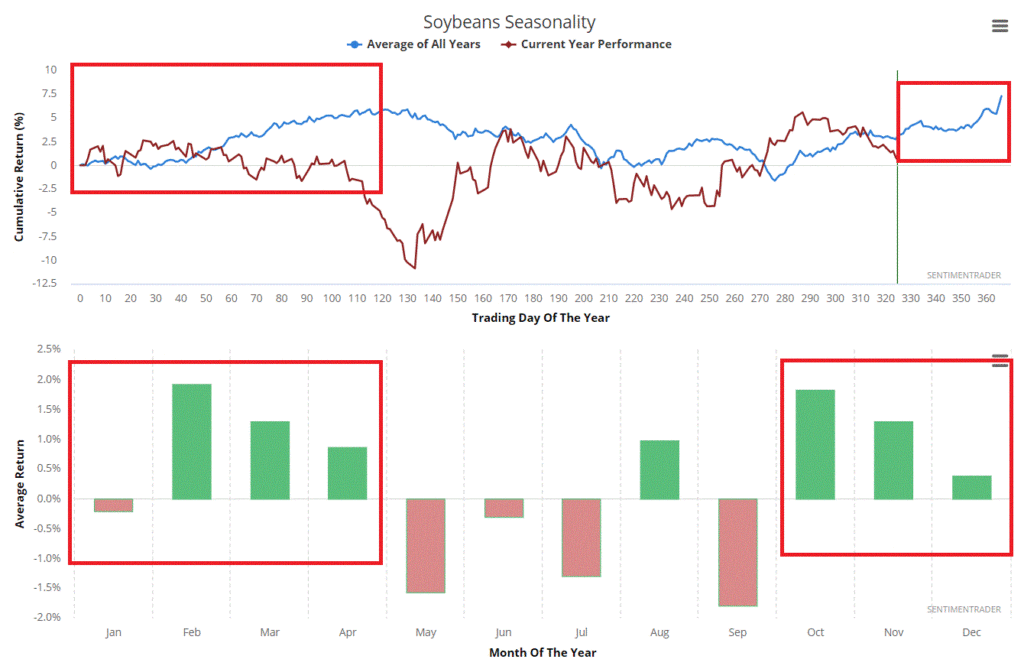
Figure 1 – Annual seasonal trend for Soybeans www.sentimentrader.com
It is critical to understand that this is the “average” for what has happened in the past and should in no way be viewed as a “roadmap”. Still, the point is pretty clear – late in the year through the month of April tends to be the “bullish” time for beans
Figure 2 displays the cumulative dollar gain from holding a long position in a soybean futures contract from the end of November to the end of April every year starting in 1976. On one hand the trend is favorable, on the other hand it is clearly no “sure thing”, and anything can happen on a year to year basis.
But just to be clear: the trade we will look at in a moment is a bet that the “next” such period WILL be a bullish one.
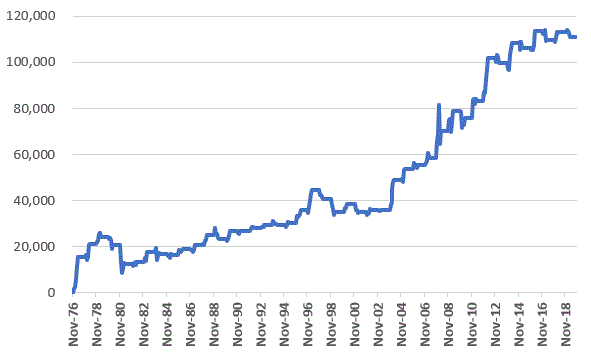
Figure 2 – $ growth for long position in soybean futures Dec-Apr; 1976-2019
Figure 3 displays the ETF ticker SOYB (which tracks soybean futures) with a potentially bullish Elliott Wave count generate by ProfitSource from HUBB.
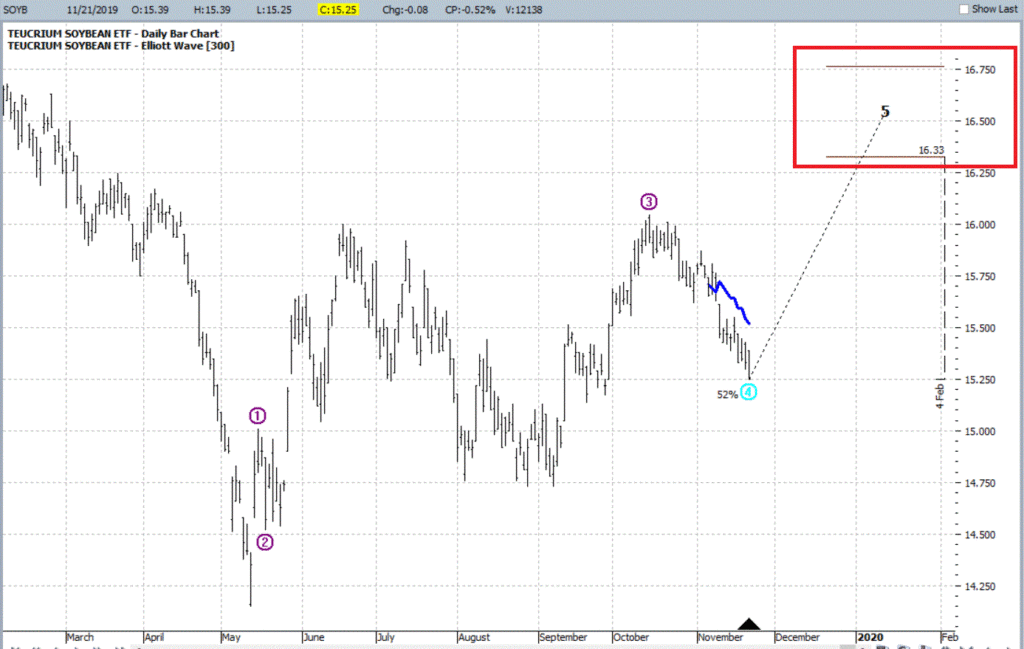
Figure 3 – ETF ticker SOYB (Source www.ProfitSource.com)
Finally, Figure 4 tells us that options on ticker SOYB are presently cheap – i.e., implied option volatility (the black line in Figure 4) is extremely low. This tells us that little option premium is built into the prices of SOYB options.
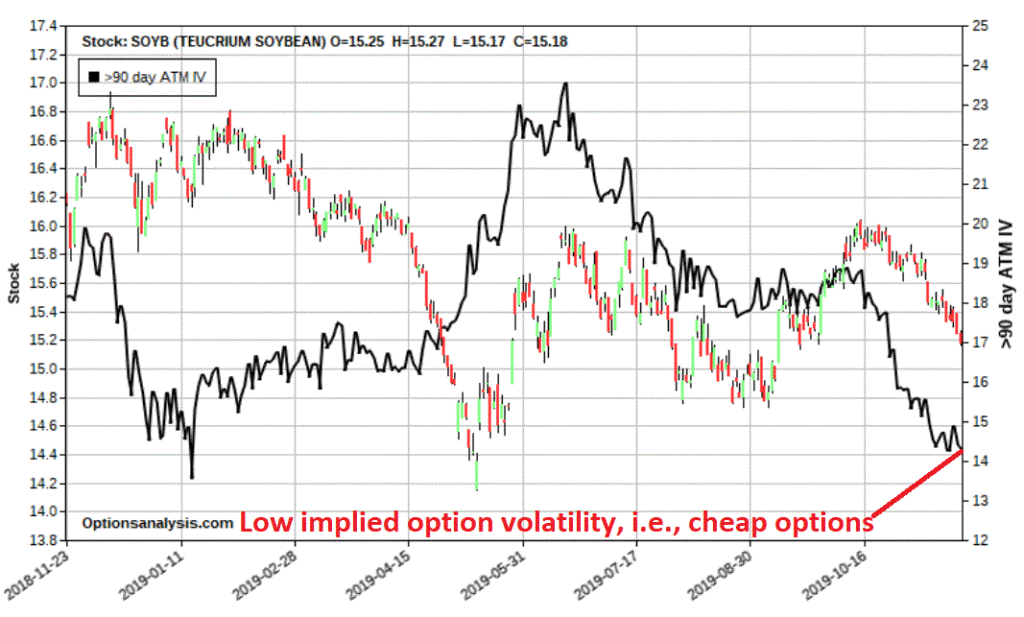
Figure 4 – Ticker SOYB with implied option volatility (Courtesy www.OptionsAnalysis.com)
Figures 5 and 6 display the particulars for one possible speculative play designed to make money if SOYB does in fact move higher sometime between now and the end of April. 2020.
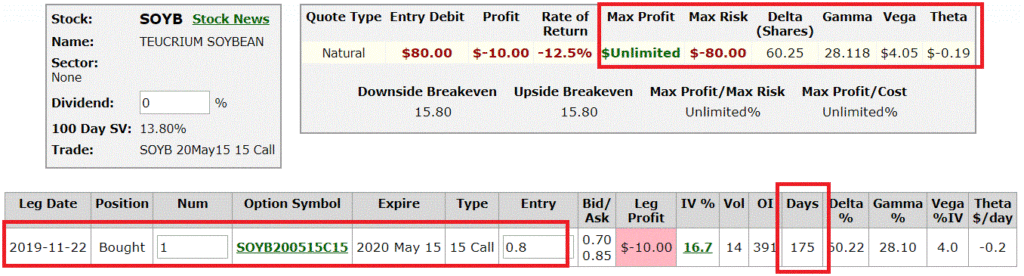
Figure 5 – SOYB May2020 calls (Courtesy www.OptionsAnalysis.com)
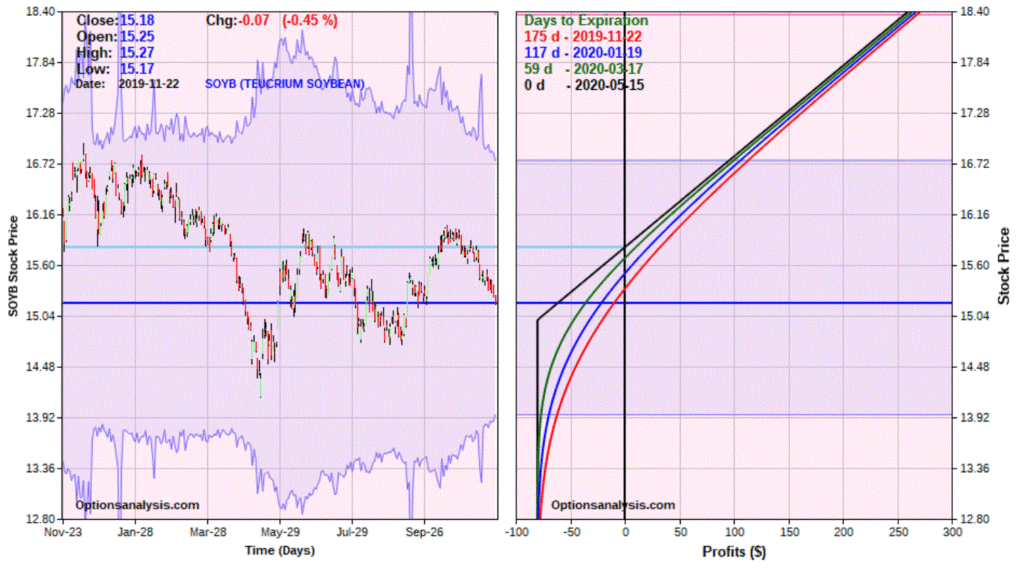
Figure 6 – SOYB May2020 call risk curves (Courtesy www.OptionsAnalysis.com)
The Elliott Wave projections in Figure 2 target $16.33 and $16.77 a share for SOYB. With SOYB at $15.18 a share this equates to a move of +8.6% and +10.5%.
For the record, between the end of November and the end of April, soybeans futures have advanced in 32 of the past 49 years (65% of the time). This trade is a bet on higher prices and a trader must accept the fact that if SOYB does not rally in some meaningful way the trade will lose money. So, looking only at the 32 up years, we find the average percentage gain for the price of soybeans was +16.1% and the standard deviation was 17.9%. So, this gives is another potential target of $17.65 a share and an “extreme” target (average plus standard deviation = +34%) of $20.38.
It is important to note that these target prices (in my mind) are NOT “predictions”. They are possibilities to be considered when assessing whether the upside potential justifies even taking the trade in the first place versus the downside risk.
Downside risk
We are assuming the May2020 15 call is purchased at a price of $0.80 per contract, or $80 per contract. This is the maximum risk on the trade.
Upside potential
The approximate expected profit at expiration at our target prices are as follows:
| SOYB price | Approximate option profit |
| $16.33 | +$50 |
| $16.77 | +$99 |
| $17.65 | +$190 |
| $20.38 | +$462 |
So, the bottom-line questions for a trader in considering this trade are:
*Are you OK with risking $80 per contract on the hopes that soybeans will rise between now and the end of April 2020?
*If you do enter the trade, how many contracts will you buy/what percentage of your trading capital will you risk?
*If SOYB fails to rally will you simply hold the options or will you consider exiting early if – for example – a key support level is broken?
*If SOYB does advance at what share price or option trade profit level will you, a) take a profit or b) adjust the trade?
Buying inexpensive call options is something of a siren song for a lot of traders and can lead to mistakes. But sometimes it can make a lot of sense as long as you:
*Put as many factors in your favor
*Don’t bet the ranch
*Formulate and follow a trade plan
Jay Kaeppel
Disclaimer: The information, opinions and ideas expressed herein are for informational and educational purposes only and are based on research conducted and presented solely by the author. The information presented does not represent the views of the author only and does not constitute a complete description of any investment service. In addition, nothing presented herein should be construed as investment advice, as an advertisement or offering of investment advisory services, or as an offer to sell or a solicitation to buy any security. The data presented herein were obtained from various third-party sources. While the data is believed to be reliable, no representation is made as to, and no responsibility, warranty or liability is accepted for the accuracy or completeness of such information. International investments are subject to additional risks such as currency fluctuations, political instability and the potential for illiquid markets. Past performance is no guarantee of future results. There is risk of loss in all trading. Back tested performance does not represent actual performance and should not be interpreted as an indication of such performance. Also, back tested performance results have certain inherent limitations and differs from actual performance because it is achieved with the benefit of hindsight.

