The good news is that crude oil is about to enter a “seasonally favorable” period. The bad news is that this in absolutely no way guarantees that crude oil is certain to rise during this period this year. I hate that part.
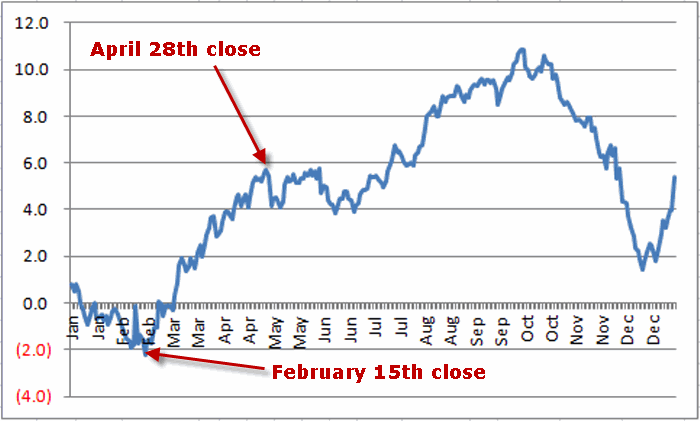
Figure 1 displays an annual seasonal chart for crude oil.
 Figure 1 – Annual Seasonal Trend Chart for Crude Oil futures
(See also Is This the Greatest Buying Opportunity Ever in Crude Oil?)
If history is a guide (although unfortunately it isn’t always – more in a moment) then the outlook for crude “should” be favorable between the close on February 15th and the close on April 28th. As you can see in Figure 1 crude oil “typically”:
1) Bottoms out in mid February
2) Rallies into late April
3) Muddles along for a while
4) Then rallies into late September and then
5) The bottom drops out
Except of course that it does not always play out exactly this way every year. In fact in some years it doesn’t follow anything even remotely close to this script. Ah, there’s the rub. Actually, the most appropriate quote is this one:
“Seasonality is climate, not weather”, Michael Santoli CNBC Commentator
Exactly.
(See also One Way to Play Crude Oil Volatility and Soybeans, Crude Oil and Gold, Oh My)
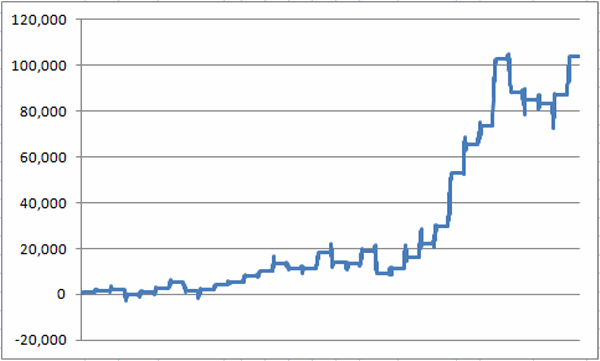
To illustrate this let’s look at the time period that extends from the end of February Trading Day of the Month (TDM) #11 through April TDM #20. The equity curve achieved by holding long one crude oil futures contract during this period every year since 1984 appears in Figure 2. Figure 2 – $ gain for crude oil futures between Feb TDM 11 and Apr TDM 20 (1984-2016)
For the record:
*# times crude oil UP = 23 (70% of the time)
*# times crude oil down = 10 (30% of the time)
*Average gain during UP years = +$6,333
*Average loss during DOWN years = (-$4,286)
Not perfect, but remember we are looking at a “tendency” and not a “trading system.”
Here is what I take away from this type of analysis: During this time period I would rather look for ways to play the long side of crude than the short side. Nothing more, nothing less.
In other words, it is better to swim with the tide than against it.
(See also Blood in the Energy Streets and Blood in the Energy Streets (Part II))
Extending Seasonal Trends Even Longer
To illustrate just how “seasonal” crude oil’s performance is, let’s extend things a little further. Based on the results in Figure 1, let’s run the following test:
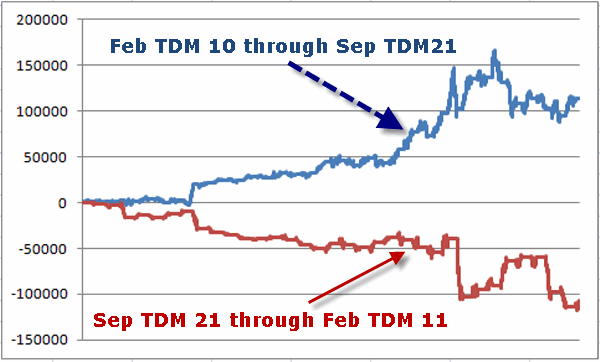
Test A) Hold long 1 crude oil futures contract from the close on February Trading Day #11 through the close on September Trading Day #21
Test B) Hold long 1 crude oil futures contract from the close on September Trading Day #21 through the close on February Trading Day #11
The results for these two tests appear in Figure 3. Figure 3 – Gain/loss for crude oil futures during two separate time periods each year (from 4/5/1983 through 12/31/2016)
As you can see in Figure 3 there are some big drops during the supposedly “bullish” period (blue line) and some big rallies during the supposedly “bearish” periods (red line). Still, in the long run the difference is pretty stark.
For the record:
*Between Feb TDM 11 and Sep TDM 21 crude oil futures have gained +$113,600.
*Between Sep TDM 21 and Feb TDM 11 crude oil futures have lost -$107,470.
Summary
I don’t mean to be crude (OK, sorry I couldn’t resist) but the purpose of this article is NOT to suggest that you buy crude oil futures on Feb TDM 11 and go short on Sep TDM 21. Again, we are not talking about a “systematic” approach to trading crude oil.
What we are talking about is using seasonal trend bias to help guide one’s approach to trading by putting as many factors as possible in one’s favor.
Jay Kaeppel
Disclaimer: The data presented herein were obtained from various third-party sources. While I believe the data to be reliable, no representation is made as to, and no responsibility, warranty or liability is accepted for the accuracy or completeness of such information. The information, opinions and ideas expressed herein are for informational and educational purposes only and do not constitute and should not be construed as investment advice, an advertisement or offering of investment advisory services, or an offer to sell or a solicitation to buy any security.

