One of the oldest, coldest and cruelest adages in investing states that the time to buy is when “there is blood in the streets.” It occurred to me today that we may be getting close to that point in the energy sector.
Don’t get me wrong, I am not making any bold proclamations here. I am as fearful of diving into the energy sector as the next guy at the moment. I have no idea how much further crude oil may fall and I have no way of saying for certain that the predictions of $20 or $10 a barrel will not play out. So I am in no big rush to “dive in” here.
Still…absolutely everything that I read about the energy sector is now uniformly bearish. Does this or does this not qualify as “blood in the streets?”
An Interesting “Spike”
I read www.ZeroHedge.com and suggest that you do also. It contains a lot of information without any “sugar coating” and I find it to be a valuable source of information that I don’t find in other places. That being said, I noticed something in a recent post that struck me in a very contrarian kind of way. In this post the author rightly points out the frightening fact that Wells Fargo presently has $17 billion (that’s billion with a “b”) in outstanding – mostly non-investment grade – energy sector loans. The frightening implications – dire straits for the banking Industry, the threat of another 2008-type financial meltdown, etc. – are not to be ignored.
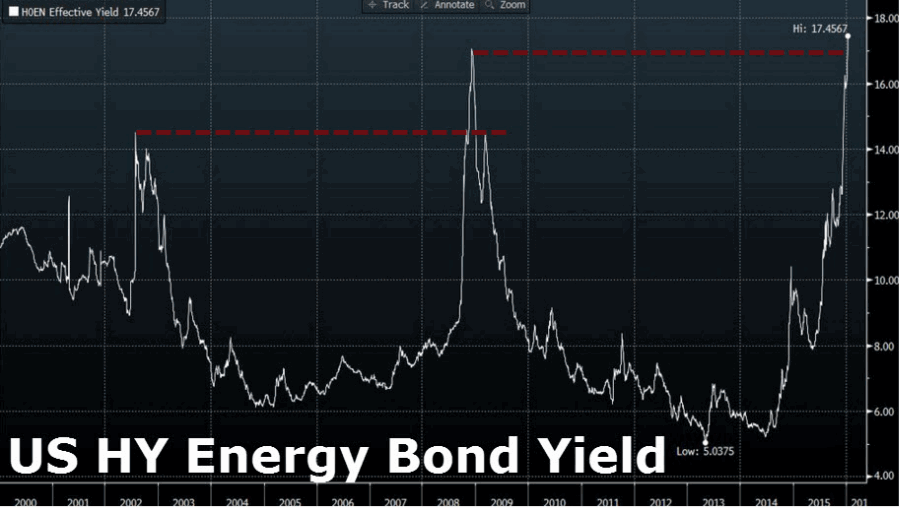
But there was also a chart included, which is captured as displayed in Figure 1 below. It displays the U.S. High Yield Energy Bond Yield.  Figure 1 – U.S. High Yield Energy Bond Yield (Source: www.ZeroHedge.com)
The value in the chart has spiked to a new all-time high, eclipsing the previous high from 2008, which eclipsed the previous high from 2002. It is a fairly simple reaction to look at the chart and gasp “Whoa”. But something popped in my head and (unlike a lot of things that pop into my head) I was right about this one.
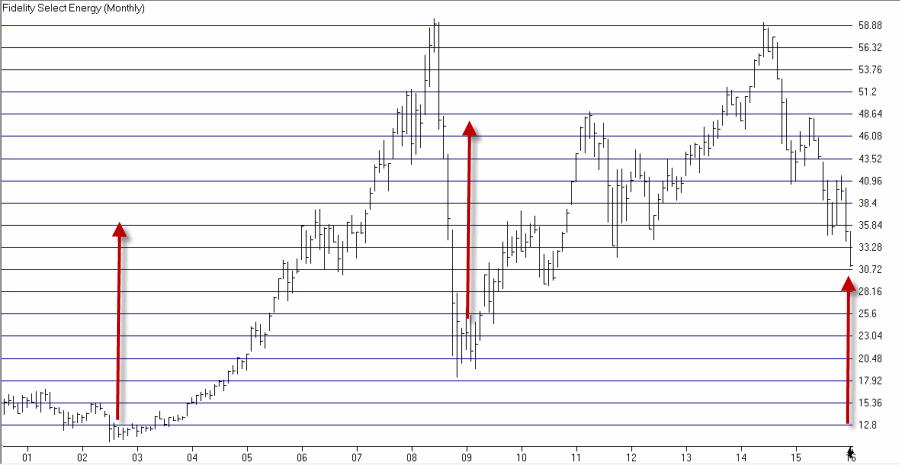
Figure 2 displays Fidelity Select Energy (FSENX) with the dates of three spikes from Figure 1 highlighted. Notice anything interesting? Figure 2 – Fidelity Select Energy(Courtesy AIQ TradingExpert)
The bottom line is that the two previous spikes marked major bear market lows for energy stocks – in mid-2002 and the end of 2008. So will it play out this way again this time around? Or are we really headed for the financial apocalypse this time around?
I do not presume to know the answer.
But I think it may be about time to start looking at the energy sector as a potential buying opportunity (although I do think it makes sense to wait for some sign of an end to the waterfall decline in the price of all things energy).
Jay Kaeppel

