Monthly Archives: October 2020

Is it Time to “Get Small”?

Much has been said and written about the underperformance of small-cap stocks relative to large-cap stocks in recent years.  Of course, like a lot of things – growth vs. value, U.S. vs. international. Stocks vs. Bonds, etc. – there are no “permanent advantages” in the financial markets.  The ebb and flow among assets classes and sectors function much like waves in the ocean.  Some are more or less pronounced and/or last longer or shorter than others, but nothing lasts forever.

A Small-Cap “Thrust”

Jason Goepfert of www.Sentimentrader.com highlighted a potentially significant development in the small-cap space.  As you can see in Figure 1, previously when the Russell 2000 Index has rallied more than 10% in 10 trading days the index has tended to continue to move higher.  Specifically, it has been higher 1 month later 100% of the time.

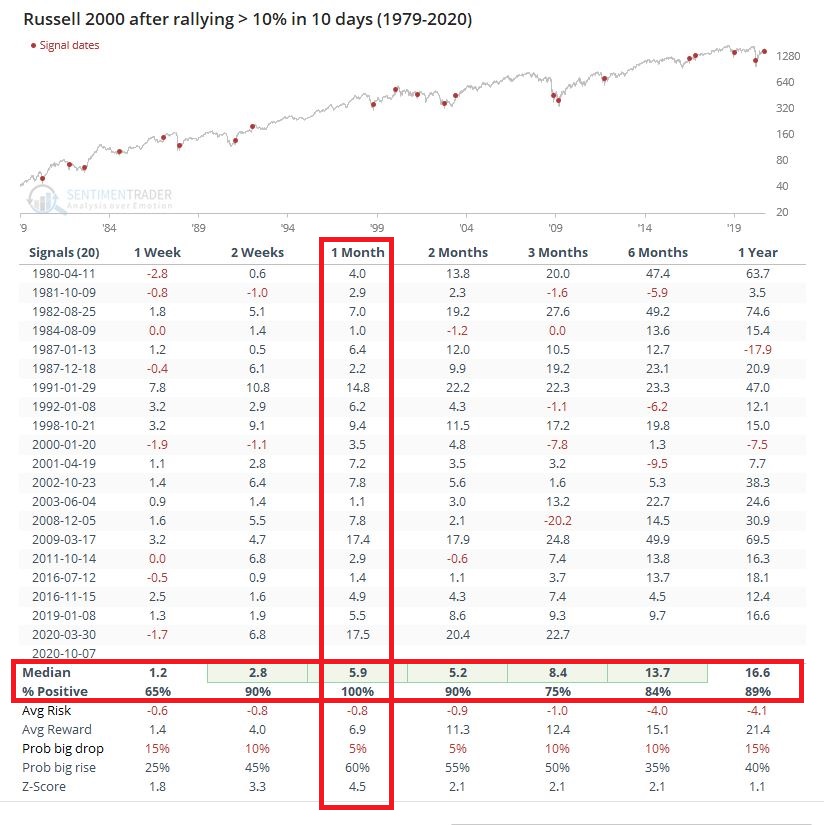
Figure 1 – Russell 2000 when it rises 10%+ in 10 trading days (Courtesy Sentimentrader.com)

Important Caveat: This IS NOT meant to imply that there is a 100% probability that RUT will be higher 1-month from now “this time around.”  It is simply meant to highlight an opportunity with the potential for success and the importance of trying to put the odds in your favor as much as – and whenever – possible.

How to Play

The most straightforward approach to making a play would likely be to simply buy 100 shares of ticker IWM (the iShares ETF that tracks the Russell 2000 Index).  Figure 2 displays the risk “curves” for holding long 100 shares of IWM. 

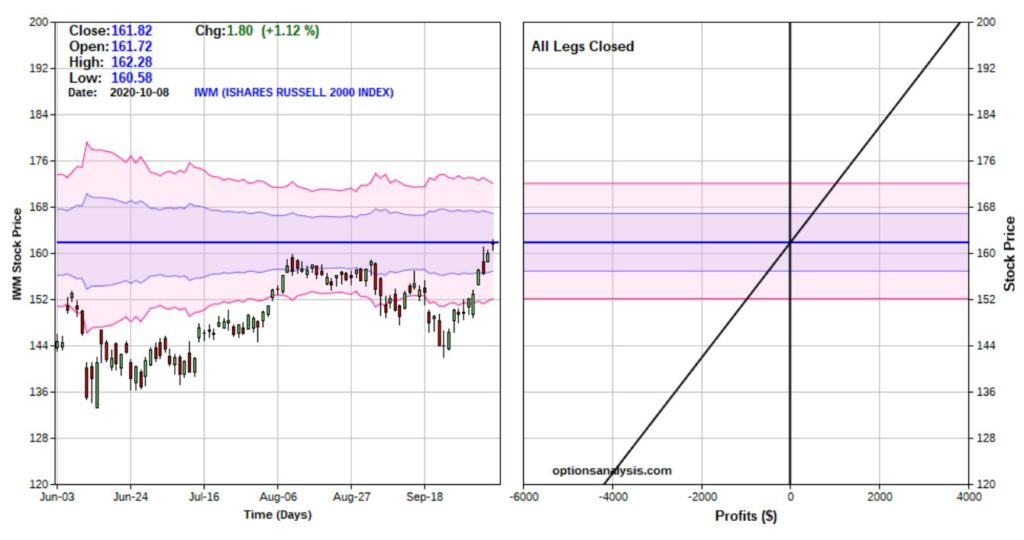
Figure 2 – Risk curves for holding long 100 shares of IWM (Courtesy www.OptionsAnalysis.com)

With IWM trading at $161.82 a share, the cost to enter this trade is $16,182.  As you can see, for a stock position the risk “curves” are simply a straight line.  For each $1 IWM rises in price the position gains $100 ($1 x 100 shares) and for each $1 IWM declines in price the position losses $100.  Like I said, pretty straightforward.

Now let’s consider a hypothetical Trader A, who wants to enter a bullish position for 1-month, but does not necessarily want to plunk down $16+ grand for the privilege.

One potential alternative might be to buy the IWN Nov06 151 strike price call.  If Trader A buys this call at $13.21 for a 1-lot they would pay $1,321 for a 1-lot (which costs 92% less than buying 100 share).

This position has a “delta” of 76.53 – which means that the profit/loss potential is roughly the same as buying 76 or 77 shares of IWM.  Figure 3 displays the particulars for this position. 

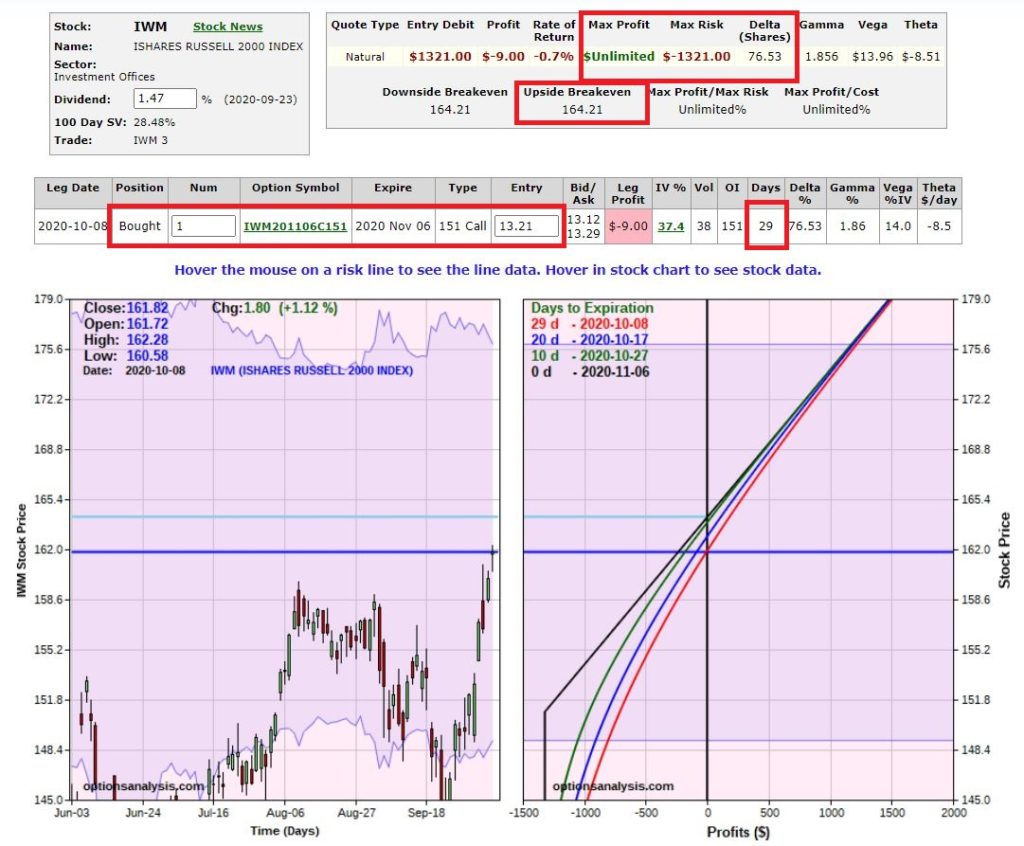
Figure 3 – Long 1 IWM Nov06 151 call (Courtesy www.OptionsAnalysis.com)

Now let’s compare the two positions.  Figure 4 overlays the risk curves for the long 100 shares of IWM position (gray line) versus holding the 151-strike price call (black line).

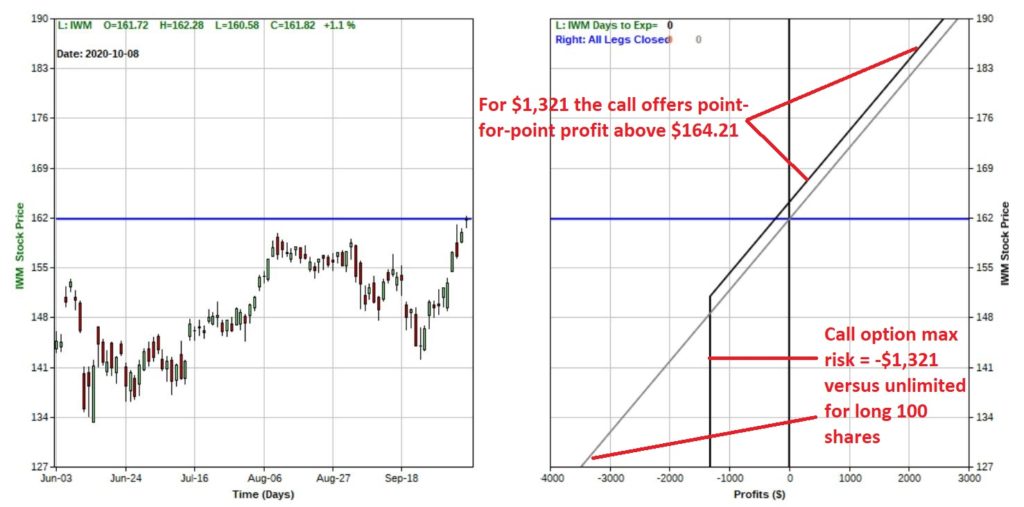
Figure 4 – Long stock vs. long call option (Courtesy www.OptionsAnalysis.com)

Things to Note:

*The stock position costs $16,182 to enter and offers point-for-point profit with the underlying shares.  The breakeven price is $161.82 a share, profit potential is unlimited and the $ loss increases with each point IWM declines.

*The option position costs $1,321 to enter.  The breakeven price is $164.21.  Above this price the option position enjoys point-for-point movement with the stock.  The maximum risk is $1,321.

To put things in perspective, let’s assume that on the day of option expiration that IWM is trading at $175 a share:

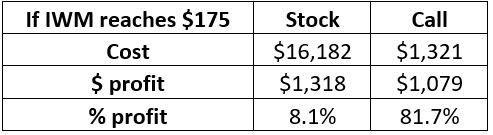
Figure 5 – What if? IWM is at $175 a share at option expiration (Courtesy www.OptionsAnalysis.com)

Call option pros:

*The cost is only $1,321 versus $16,182 for the stock position

*Above $164.21 a share, the call offers point-for-point profit with the stock

*Potential % return is much greater

*Worst case: if IWM were to crash the loss is capped at -$1,321 below $151 a share

Call option cons:

*Because of time premium, the call option gives up the first few points of profit potential with a breakeven price of $164.21. 

*The option expires in 28 days so IWM must make a move within that time frame in order to generate a profit.

Summary

So, is a bullish trade on small-cap stocks warranted?  And if so, which is the better play – shares or a call option?

Neither of these questions are for me to answer. 

For the record, I am not recommending small-cap stocks nor options versus shares. The sole purpose is to educate investors and traders about how to spot potential opportunities and how to compare the relative pros and cons of various alternative trading approaches.

Each trader must weigh the pros and cons of both the potential and the risks of the opportunity itself and the various “ways to play” and make their own decisions.

See also Jay Kaeppel Interview in July 2020 issue of Technical Analysis of Stocks and Commodities magazine

See also Jay’s “A Strategy You Probably Haven’t Considered” Video

See also Video – The Long-Term…Now More Important Than Ever

Jay Kaeppel

Disclaimer: The information, opinions and ideas expressed herein are for informational and educational purposes only and are based on research conducted and presented solely by the author.  The information presented represents the views of the author only and does not constitute a complete description of any investment service.  In addition, nothing presented herein should be construed as investment advice, as an advertisement or offering of investment advisory services, or as an offer to sell or a solicitation to buy any security.  The data presented herein were obtained from various third-party sources.  While the data is believed to be reliable, no representation is made as to, and no responsibility, warranty or liability is accepted for the accuracy or completeness of such information.  International investments are subject to additional risks such as currency fluctuations, political instability and the potential for illiquid markets.  Past performance is no guarantee of future results.  There is risk of loss in all trading.  Back tested performance does not represent actual performance and should not be interpreted as an indication of such performance.  Also, back tested performance results have certain inherent limitations and differs from actual performance because it is achieved with the benefit of hindsight.

The Calm Before the Bond Storm?

The bond market was very quiet in the 3rd quarter.  Figure 1 displays ticker IEF (7-10 year treasuries ETF) in the to clip and ticker AGG (Aggregate Bond Index ETF) in the bottom clip. 

Figure 1 – Tickers IEF and AGG in narrow ranges (Courtesy AIQ TradingExpert)

(See also JayOnTheMarkets.com: Thanks for the Kind Words)

Essentially the entire bond market has been flat since early June.  The market seems to be assuming that “the Fed will take of everything” and keep interest rates low and stable for the foreseeable future so…..ZZZZZZZZ.

But this type of activity often breeds complacency.  I am not making any predictions here but I do want to raise a question that investors might wish to ponder, i.e., “what would be more shocking that a spike in interest rates?”  OK, yes, I realize it is 2020 and it is pretty much hard to be shocked by anything anymore.  But still, on a relative basis how many investors are even thinking about the potential risk of higher interest rates at the moment?

Could it Happen?

The Bond Market VIX (ticker MOVE) recently fell to its lowest level ever (before spiking sharply higher on 10/5/20).  As you can see in Figure 2 this type of “quietness” often precedes a significant move in the bond market.  For the record, low readings in MOVE can be followed by large up moves in price as easily as large down moves in price.  So, a low MOVE reading is not “bearish” per se, but rather merely suggests that we are experiencing the “calm before the storm.”

Figure 2 – Bond Market VIX hit an all-time low (Courtesy Sentimentrader.com)

So why is my “Spidey sense” tingling?  Figure 3 displays the yield on 30-year treasuries (ticker TYX) on the bottom and an indicator I refer to as VFAA on the bottom (the calculation appears at the end of this piece).  VFAA is a derivative on a Larry William’s indicator he calls VixFix.

Figure 3 – 30-year treasury yields with VFAA suggesting a potential bottoming area (Courtesy AIQ TradingExpert)

As you can see in Figure 3, peaks in the VFAA indicator often occur near intermediate term lows in bond yields (reminder: bond prices move inversely to yield, so a bottom in interest rates indicates a top in bond prices).  As you can also see on the far-right hand side, the stage clearly appears to be set for “the next go round.”

Why does this matter?  If interest rates do rise in the months ahead bond prices – particularly long-term bond prices can get hit hard.  To illustrate the potential risks, Figure 4 displays the action of treasury security ETFs of various maturity during a 5-month rise in rates back in 2016.

Figure 4 – Bond ETF action during rate rise in 2016

Summary

It is possible for long and short-term bonds to “de-couple”.  In other words, the possibilities are:

*Short-term rates remain stable (as the Fed keeps pumping) while long-term rates rise (as inflation fears arise as a result of all the Fed pumping)

*Short-term rates remain stable while long-term rates plummet (if the economy appears to be weakening).  This would result in gains for long-term bonds only

*None of the above

The bottom line: Bonds have fallen asleep – but DO NOT fall asleep on bonds. 


VFAA Formula

Below is the code for VFAA

VixFix is an indicator developed many years ago by Larry Williams which essentially compares the latest low to the highest close in the latest 22 periods (then divides the difference by the highest close in the latest 22 periods).  I then multiply this result by 100 and add 50 to get VixFix.

*Next is a 3-period exponential average of VixFix

*Then VFAA is arrived at by calculating a 7-period exponential average of the previous result (essentially, we are “double-smoothing” VixFix)

Are we having fun yet?  See code below:

hivalclose is hival([close],22).

vixfix is (((hivalclose-[low])/hivalclose)*100)+50.

vixfixaverage is Expavg(vixfix,3).

vixfixaverageave is Expavg(vixfixaverage,7).

VFAA = vixfixaverageave


See also Jay Kaeppel Interview in July 2020 issue of Technical Analysis of Stocks and Commodities magazine

See also Jay’s “A Strategy You Probably Haven’t Considered” Video

See also Video – The Long-Term…Now More Important Than Ever

Jay Kaeppel

Disclaimer: The information, opinions and ideas expressed herein are for informational and educational purposes only and are based on research conducted and presented solely by the author.  The information presented represents the views of the author only and does not constitute a complete description of any investment service.  In addition, nothing presented herein should be construed as investment advice, as an advertisement or offering of investment advisory services, or as an offer to sell or a solicitation to buy any security.  The data presented herein were obtained from various third-party sources.  While the data is believed to be reliable, no representation is made as to, and no responsibility, warranty or liability is accepted for the accuracy or completeness of such information.  International investments are subject to additional risks such as currency fluctuations, political instability and the potential for illiquid markets.  Past performance is no guarantee of future results.  There is risk of loss in all trading.  Back tested performance does not represent actual performance and should not be interpreted as an indication of such performance.  Also, back tested performance results have certain inherent limitations and differs from actual performance because it is achieved with the benefit of hindsight.

Thanks for the Kind Words

Just wanted to post a quick “Thank You” to David Taggart of PDMacro.com for the kind words in his recent tweet.

Shucks folks, I’m speechless.

See also Jay Kaeppel Interview in July 2020 issue of Technical Analysis of Stocks and Commodities magazine

See also Jay’s “A Strategy You Probably Haven’t Considered” Video

See also Video – The Long-Term…Now More Important Than Ever

Jay Kaeppel

Disclaimer: The information, opinions and ideas expressed herein are for informational and educational purposes only and are based on research conducted and presented solely by the author.  The information presented represents the views of the author only and does not constitute a complete description of any investment service.  In addition, nothing presented herein should be construed as investment advice, as an advertisement or offering of investment advisory services, or as an offer to sell or a solicitation to buy any security.  The data presented herein were obtained from various third-party sources.  While the data is believed to be reliable, no representation is made as to, and no responsibility, warranty or liability is accepted for the accuracy or completeness of such information.  International investments are subject to additional risks such as currency fluctuations, political instability and the potential for illiquid markets.  Past performance is no guarantee of future results.  There is risk of loss in all trading.  Back tested performance does not represent actual performance and should not be interpreted as an indication of such performance.  Also, back tested performance results have certain inherent limitations and differs from actual performance because it is achieved with the benefit of hindsight.

Good Companies, Troubled Stocks and Potential Opportunity

Truth be told I am not much of a “stock picker”. Oh, I can pick ‘em alright just like anyone else.  They just to don’t go the right way as often as I’d like.  I also believe that the way to maximize profitability is to follow a momentum type approach that identifies stocks that are performing well and buying them when they breakout to the upside (ala O’Neil, Minervini, Zanger, etc.) and then riding them as long as they continue to perform.  Unfortunately, I’m just not very good at it. 

Back when I started out, there was such a thing as a “long-term investor.”  People would try to find good companies selling at a decent price and they would buy them and hold them for, well, the long-term.  Crazy talk, right? As I have already stated, I am not claiming that that is a better approach. I am just pointing out that it was “a thing.”

An Indicator

There is an indicator (I will call it VFAA, which is short for vixfixaverageave, which – lets face it – is a terrible name) that I follow that was developed as an extension of Larry William’s VixFix Indicator.  There is nothing magic about it.  Its purpose is to identify when price has reached an exceptionally oversold level and “may” be due to rally.  The code for this indicator appears later.

For the record, I DO NOT systematically use this indicator in the manner I am about to describe, nor am I recommending that you do.  Still, it seems to have some potential value, so what follows is merely an illustration for informational purposes only.

The Rules

*We will look at a monthly bar chart for a given stock

*A “buy signal” occurs when VFAA reaches or exceeds 80 and then turns down for one month

*A “sell (or exit) signal” occurs when VFAA subsequently rises by at least 0.25 from a monthly closing low

Seeing as how this is based solely on monthly closes it obviously this is not going to be a “precision market timing tool.”

Some “Good Companies” with “Troubled Stocks”

So now let’s apply this VFAA indicator to some actual stocks.  Again, I AM NOT recommending that anyone use this approach mechanically.  The real goal is merely to try to identify situations where a stock has been washed out, reversed and MAY be ready to run for a while.

Ticker BA

Figure 1 displays a monthly chart for Boeing (BA) with VFAA at the bottom.  The numbers on the chart represent the hypothetical + (-) % achieved by applying the rules above (although once again, to be clear I am not necessarily suggesting anyone use it exactly this way). 

Figure 1 – Ticker BA with VFAA (Courtesy AIQ TradingExpert)

From March 2019 into March 2020 BA declined -80%.  It has since bounced around and VFAA has soared to 110.88.  VFAA has yet to rollover on a month-end basis, so nothing to do here except exhibit – what’s that word again – oh right, “patience.”

Ticker GD

Figure 2 displays a monthly chart for General Dynamics (GD) with VFAA at the bottom. 

Figure 2 – Ticker GD with VFAA (Courtesy AIQ TradingExpert)

Are these “world-beating numbers”?  Not really.  But in terms of helping to identify potential opportunities, not so bad. VFAA gave a “buy signal” for GD at the end of July. So far, not so good as the stock is down about -6%.

Ticker WFC

Figure 3 displays a monthly chart for Wells Fargo (WFC) with VFAA at the bottom. 

Figure 3 – Ticker WFC with VFAA (Courtesy AIQ TradingExpert)

There are not many “signals” but the ones that occurred have been useful. Between 2018 and 2020 WFC declined -65%.  It has since bounced around and VFAA has soared to 102.44.  VFAA has yet to rollover on a month-end basis. But at some point it will, and a potential opportunity may arise.

VFAA Formula

Below is the code for VFAA

VixFix is an indicator developed many years ago by Larry Williams which essentially compares the latest low to the highest close in the latest 22 periods (then divides the difference by the highest close in the latest 22 periods).  I then multiply this result by 100 and add 50 to get VixFix.

*Next is a 3-period exponential average of VixFix

*Then VFAA is arrived at by calculating a 7-period exponential average of the previous result (essentially, we are “double-smoothing” VixFix)

Are we having fun yet?  See code below:

hivalclose is hival([close],22).

vixfix is (((hivalclose-[low])/hivalclose)*100)+50.

vixfixaverage is Expavg(vixfix,3).

vixfixaverageave is Expavg(vixfixaverage,7).

VFAA = vixfixaverageave

Summary

One thing to note is that VFAA “signals” on a monthly chart don’t come around very often.  So, you can’t really sit around and wait for a signal to form on your “favorite company”.  You have to look for opportunity wherever it might exist.

One last time let me reiterate that I am not suggesting using VFAA as a standalone systematic approach to investing. But when a signal does occur – especially when applied to quality companies that have recently been “whacked”, it can help to identify a potential opportunity.

See also Jay Kaeppel Interview in July 2020 issue of Technical Analysis of Stocks and Commodities magazine

See also Jay’s “A Strategy You Probably Haven’t Considered” Video

See also Video – The Long-Term…Now More Important Than Ever

Jay Kaeppel

Disclaimer: The information, opinions and ideas expressed herein are for informational and educational purposes only and are based on research conducted and presented solely by the author.  The information presented represents the views of the author only and does not constitute a complete description of any investment service.  In addition, nothing presented herein should be construed as investment advice, as an advertisement or offering of investment advisory services, or as an offer to sell or a solicitation to buy any security.  The data presented herein were obtained from various third-party sources.  While the data is believed to be reliable, no representation is made as to, and no responsibility, warranty or liability is accepted for the accuracy or completeness of such information.  International investments are subject to additional risks such as currency fluctuations, political instability and the potential for illiquid markets.  Past performance is no guarantee of future results.  There is risk of loss in all trading.  Back tested performance does not represent actual performance and should not be interpreted as an indication of such performance.  Also, back tested performance results have certain inherent limitations and differs from actual performance because it is achieved with the benefit of hindsight.

Buy Energy Stocks – But Not Right Now

Jason Goepfert, the Editor of www.Sentimentrader.com has done yeoman’s work in chronicling just how ugly things have gotten in the energy sector, how much the sector is loathed and how this type of action – usually – leads to a rally.  More on that a little later.

I highlighted some info from www.Sentimentrader.com regarding energy executive insider buying here.  So, is this the exact right time to take the plunge and dive headlong into the deep end of the energy pool?  It beats me.  I certainly do find the “washed out” case to be compelling.  But I for one will be waiting at least until December 1st

Figure 1 displays the cumulative % gain for Fidelity Select Energy Services (used as a proxy for the energy industry) ONLY during the months of October and November every year since 1986.  It’s not pretty.

Figure 1 – FSESX Oct-Nov ONLY cumulative %; 1986-2019

Figure 2 displays the relevant facts and figures.

Figure 2 – Relevant Facts and Figures

Figure 3 displays year-by-year total return results for FSESX during the months of October and November.

YearFSESX Oct/Nov % +(-)
1986 (0.2)
1987 (42.7)
1988 (7.5)
1989 3.2
1990 (11.2)
1991 (10.7)
1992 (7.1)
1993 (11.8)
1994 (1.4)
1995 (3.5)
1996 15.6
1997 (8.9)
1998 (12.7)
1999 2.4
2000 (24.2)
2001 23.3
2002 12.2
2003 (3.0)
2004 5.8
2005 (0.7)
2006 13.4
2007 (4.7)
2008 (44.2)
2009 (0.8)
2010 16.1
2011 24.3
2012 (4.6)
2013 1.9
2014 (22.1)
2015 10.0
2016 10.5
2017 (5.8)
2018 (27.8)
2019 (0.4)

Figure 3 – FSESX October-November Year-by-Year

Summary

In 2001 FSESX advanced +23.3% during Oct/Nov and in 2011 it rallied +24.3% during Oct/Nov.  So, there is no reason energy stocks cannot surprise the investment world and launch a rip-roaring rally in the months directly ahead, especially given how beaten down and unloved they are at the moment.

Still, investing is a game of odds.  Given that energy stocks have showed a gain only 35% of the time during October and November, I for one intend to “exhibit a bit more patience.”

For a possible glimpse of the future however, please consider Figure 4 from www.Sentimentrader.com, which displays what has happened in the past after a flurry of dividend cuts in this sector.  6 months to 2-year returns have been positive 100% of the time.

Figure 4 – Energy sector performance after 4 or more dividend cuts among constituent stocks of ticker XLE (Courtesy Sentimentrader.com)

Bottom line: Don’t go to sleep on energy stocks – but maybe hit the “Snooze” button one more time.

See also Jay Kaeppel Interview in July 2020 issue of Technical Analysis of Stocks and Commodities magazine

See also Jay’s “A Strategy You Probably Haven’t Considered” Video

See also Video – The Long-Term…Now More Important Than Ever

Jay Kaeppel

Disclaimer: The information, opinions and ideas expressed herein are for informational and educational purposes only and are based on research conducted and presented solely by the author.  The information presented represents the views of the author only and does not constitute a complete description of any investment service.  In addition, nothing presented herein should be construed as investment advice, as an advertisement or offering of investment advisory services, or as an offer to sell or a solicitation to buy any security.  The data presented herein were obtained from various third-party sources.  While the data is believed to be reliable, no representation is made as to, and no responsibility, warranty or liability is accepted for the accuracy or completeness of such information.  International investments are subject to additional risks such as currency fluctuations, political instability and the potential for illiquid markets.  Past performance is no guarantee of future results.  There is risk of loss in all trading.  Back tested performance does not represent actual performance and should not be interpreted as an indication of such performance.  Also, back tested performance results have certain inherent limitations and differs from actual performance because it is achieved with the benefit of hindsight.