Truth be told I am not much of a “stock picker”. Oh, I can pick ‘em alright just like anyone else. They just to don’t go the right way as often as I’d like. I also believe that the way to maximize profitability is to follow a momentum type approach that identifies stocks that are performing well and buying them when they breakout to the upside (ala O’Neil, Minervini, Zanger, etc.) and then riding them as long as they continue to perform. Unfortunately, I’m just not very good at it.
Back when I started out, there was such a thing as a “long-term investor.” People would try to find good companies selling at a decent price and they would buy them and hold them for, well, the long-term. Crazy talk, right? As I have already stated, I am not claiming that that is a better approach. I am just pointing out that it was “a thing.”
An Indicator
There is an indicator (I will call it VFAA, which is short for vixfixaverageave, which – lets face it – is a terrible name) that I follow that was developed as an extension of Larry William’s VixFix Indicator. There is nothing magic about it. Its purpose is to identify when price has reached an exceptionally oversold level and “may” be due to rally. The code for this indicator appears later.
For the record, I DO NOT systematically use this indicator in the manner I am about to describe, nor am I recommending that you do. Still, it seems to have some potential value, so what follows is merely an illustration for informational purposes only.
The Rules
*We will look at a monthly bar chart for a given stock
*A “buy signal” occurs when VFAA reaches or exceeds 80 and then turns down for one month
*A “sell (or exit) signal” occurs when VFAA subsequently rises by at least 0.25 from a monthly closing low
Seeing as how this is based solely on monthly closes it obviously this is not going to be a “precision market timing tool.”
Some “Good Companies” with “Troubled Stocks”
So now let’s apply this VFAA indicator to some actual stocks. Again, I AM NOT recommending that anyone use this approach mechanically. The real goal is merely to try to identify situations where a stock has been washed out, reversed and MAY be ready to run for a while.
Ticker BA
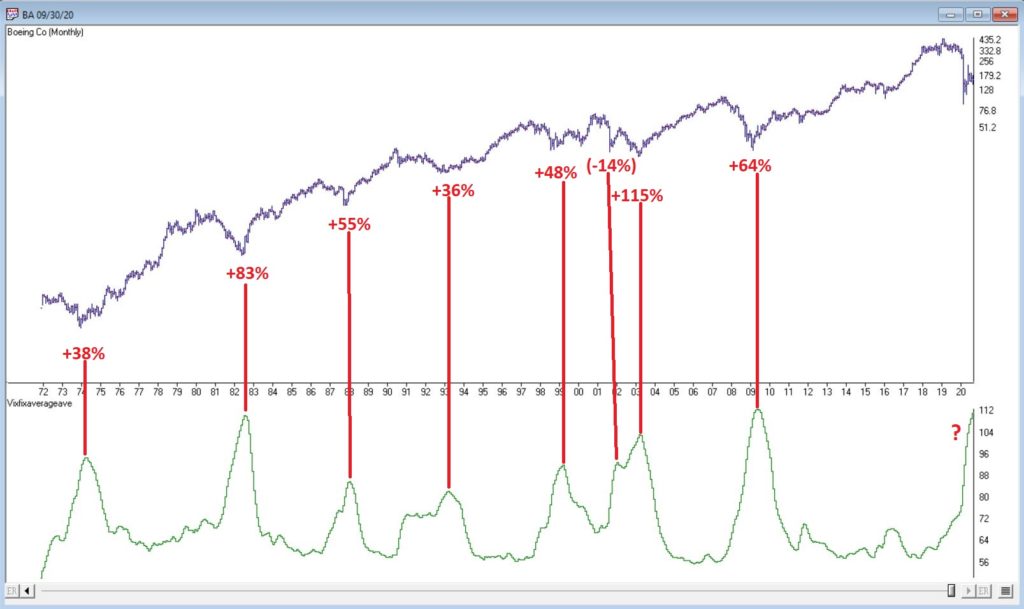
Figure 1 displays a monthly chart for Boeing (BA) with VFAA at the bottom. The numbers on the chart represent the hypothetical + (-) % achieved by applying the rules above (although once again, to be clear I am not necessarily suggesting anyone use it exactly this way).

Figure 1 – Ticker BA with VFAA (Courtesy AIQ TradingExpert)
From March 2019 into March 2020 BA declined -80%. It has since bounced around and VFAA has soared to 110.88. VFAA has yet to rollover on a month-end basis, so nothing to do here except exhibit – what’s that word again – oh right, “patience.”
Ticker GD
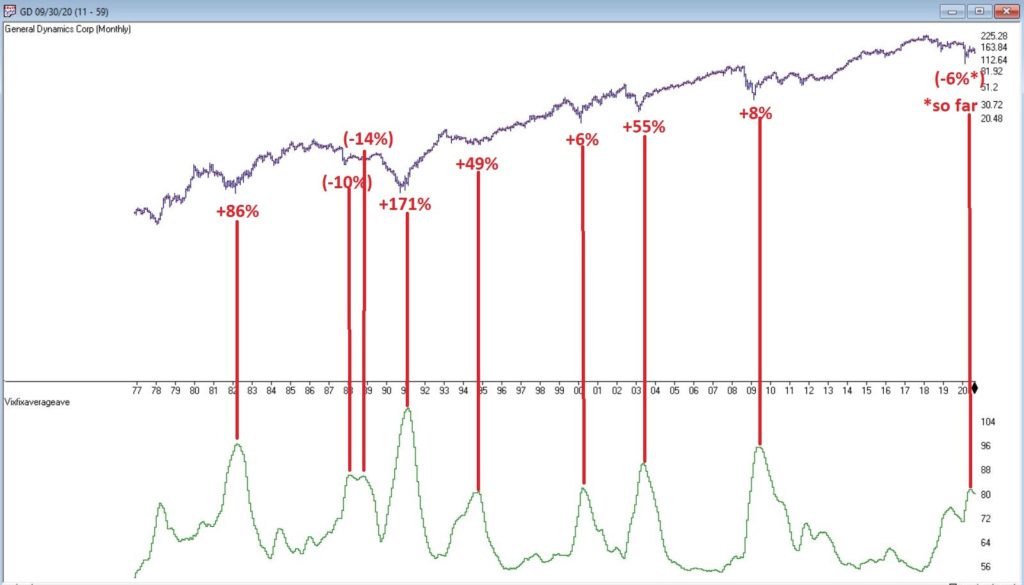
Figure 2 displays a monthly chart for General Dynamics (GD) with VFAA at the bottom.

Figure 2 – Ticker GD with VFAA (Courtesy AIQ TradingExpert)
Are these “world-beating numbers”? Not really. But in terms of helping to identify potential opportunities, not so bad. VFAA gave a “buy signal” for GD at the end of July. So far, not so good as the stock is down about -6%.
Ticker WFC
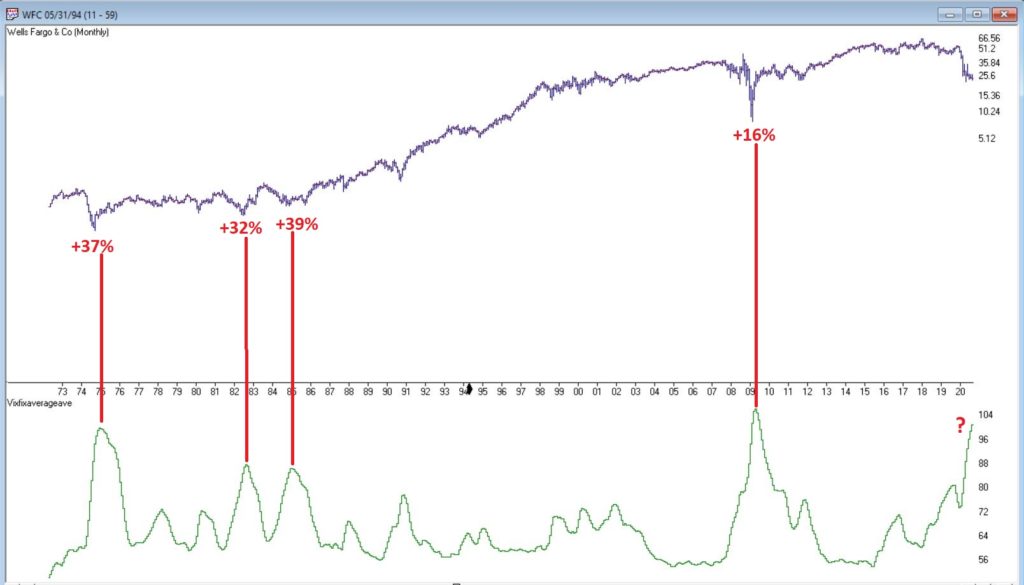
Figure 3 displays a monthly chart for Wells Fargo (WFC) with VFAA at the bottom.

Figure 3 – Ticker WFC with VFAA (Courtesy AIQ TradingExpert)
There are not many “signals” but the ones that occurred have been useful. Between 2018 and 2020 WFC declined -65%. It has since bounced around and VFAA has soared to 102.44. VFAA has yet to rollover on a month-end basis. But at some point it will, and a potential opportunity may arise.
VFAA Formula
Below is the code for VFAA
VixFix is an indicator developed many years ago by Larry Williams which essentially compares the latest low to the highest close in the latest 22 periods (then divides the difference by the highest close in the latest 22 periods). I then multiply this result by 100 and add 50 to get VixFix.
*Next is a 3-period exponential average of VixFix
*Then VFAA is arrived at by calculating a 7-period exponential average of the previous result (essentially, we are “double-smoothing” VixFix)
Are we having fun yet? See code below:
hivalclose is hival([close],22).
vixfix is (((hivalclose-[low])/hivalclose)*100)+50.
vixfixaverage is Expavg(vixfix,3).
vixfixaverageave is Expavg(vixfixaverage,7).
VFAA = vixfixaverageave
Summary
One thing to note is that VFAA “signals” on a monthly chart don’t come around very often. So, you can’t really sit around and wait for a signal to form on your “favorite company”. You have to look for opportunity wherever it might exist.
One last time let me reiterate that I am not suggesting using VFAA as a standalone systematic approach to investing. But when a signal does occur – especially when applied to quality companies that have recently been “whacked”, it can help to identify a potential opportunity.
See also Jay Kaeppel Interview in July 2020 issue of Technical Analysis of Stocks and Commodities magazine
See also Jay’s “A Strategy You Probably Haven’t Considered” Video
See also Video – The Long-Term…Now More Important Than Ever
Jay Kaeppel
Disclaimer: The information, opinions and ideas expressed herein are for informational and educational purposes only and are based on research conducted and presented solely by the author. The information presented represents the views of the author only and does not constitute a complete description of any investment service. In addition, nothing presented herein should be construed as investment advice, as an advertisement or offering of investment advisory services, or as an offer to sell or a solicitation to buy any security. The data presented herein were obtained from various third-party sources. While the data is believed to be reliable, no representation is made as to, and no responsibility, warranty or liability is accepted for the accuracy or completeness of such information. International investments are subject to additional risks such as currency fluctuations, political instability and the potential for illiquid markets. Past performance is no guarantee of future results. There is risk of loss in all trading. Back tested performance does not represent actual performance and should not be interpreted as an indication of such performance. Also, back tested performance results have certain inherent limitations and differs from actual performance because it is achieved with the benefit of hindsight.

