The recent “concentration” in the March-August 2020 rally is pretty well acknowledged at this point. Apple, Amazon, Facebook, Nvidia, Tesla, Microsoft, growth, momentum, tech, etc. go up pretty much all the time – everything else, maybe yes, maybe no.
And his kind of ride is great. While it lasts. Now the market is selling off for three days and suddenly everyone wants to know if its time to panic. So, let’s talk “perspective”.
The Here and Now
Since the Covid panic in February and March, the stock market has staged a historic rally. The rally has been dominated by large-cap/growth/tech/momentum stocks.
*September-October: Anything can happen, so be prepared
*November-April 2021: Based on several seasonal factors plus a lot of bullish momentum signals I look for a resumption/continuation of the bull market into spring 2021
*May-Oct 2021: Based primarily on seasonal factors, the market could easily struggle between mid-2021 and mid-2022. But that’s all a way off and mere prognostication.
For now, let’s focus on a few obvious trends – trends which may be getting a bit “stretched.”
Apple vs. The Little Guy
Figure 1 displays the market capitalization of AAPL versus the ENTIRE Russell 2000 Index.
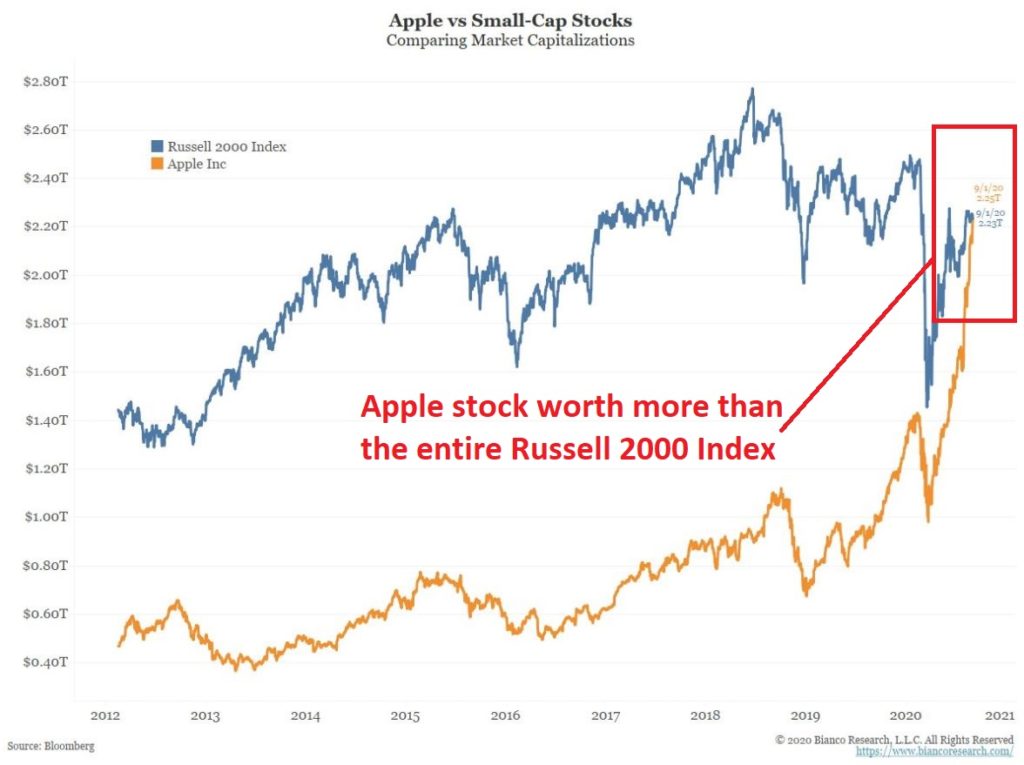
Figure 1 – Apple vs. Russell 2000 market capitalization (Courtesy: www.BiancoResearch.com)
I am going to give you my perspective as straight as possible. Apple is a great company, it will likely continue to be a great company for a long time, and I have no idea when the price of the stock will top out. All that being said – and even forgetting Apple the company for one second – this type of herd mentality concentration in one asset almost NEVER works out well in the end. The same can be said for Tesla stock market cap dwarfing the rest of the entire automobile industry.
So, the bottom line:
*Will AAPL and TSLA stock ultimately rise further? It wouldn’t surprise me.
*Will all of this ultimately end badly? Almost certainly.
*Should you dump these highfliers now? It beats me.
*Should you remain vigilant and be prepared to one day dump these highfliers? Absolutely.
Stock Market Returns vs. Stock Market Valuations
For the record, please note that P/E ratios are lousy timing indicators. The market can remain “overvalued” or “undervalued” for years. BUT, ultimately it does matter. Figure 2 displays the following:
*The orange line is the P/E ratio at the beginning of a given 10-year period (the P/E ratio scale is on the right)
*The bars along the way display the average annual return for the S&P 500 Index in the subsequent 10 years.
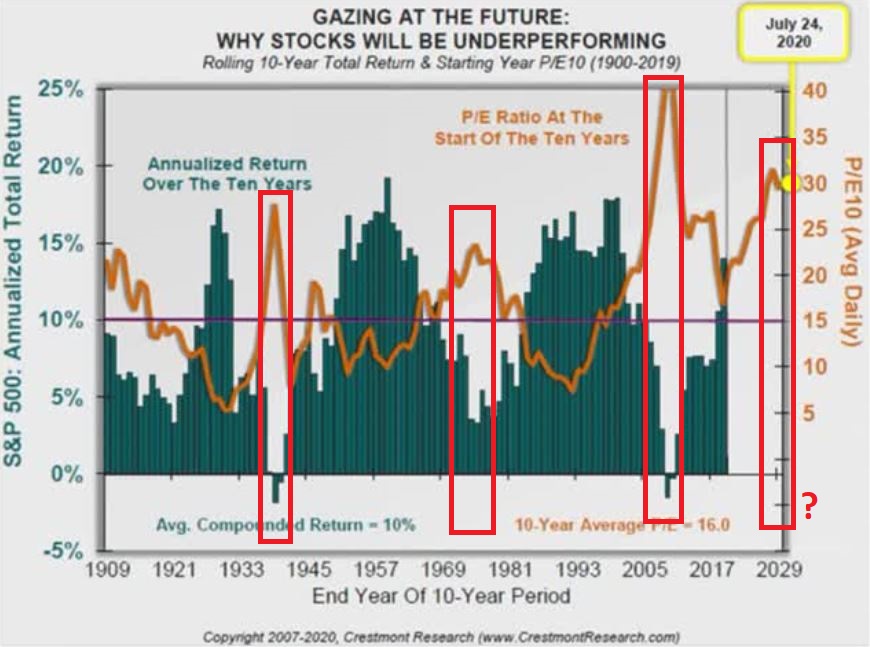
Figure 2 – Starting P/E ratio and subsequent 10-year returns (Courtesy: www.CrestmonthResearch.com)
The key thing to note:
*10-year periods that start with a high P/E ratio (look for peaks in the orange line) invariably experience below average 10-year returns
*And vice versa
*The current P/E ratio is at the high end of the historical spectrum
What does it all mean? It likely means that stock market returns over the next 10 years will NOT resemble the returns in the past 10 year.
Growth vs. Value
In recent years “Growth is God” and “Value is Dead”. The difference in performance has not even been close. So, the longer this goes on the more it becomes “a given” in the minds of many investors that this trend will continue ad infinitum. But will it? History is pretty clear on this point. With certain relationships (growth vs. value, large-cap vs. small-cap, U.S. vs. international and so on) there is a definite ebb and flow over time. Which leads us to:
Jay’s Trading Maxim #45: The only thing more foolish that trying to time the exact turning point in the ebb and flow of things is believing that a particular ebb or flow will last forever.
Figure 3 displays 10-year total return for Value versus the 10-year total return for Growth since the 1930’s. Note that the current reading is the most extreme reading in favor of growth ever using this data series.
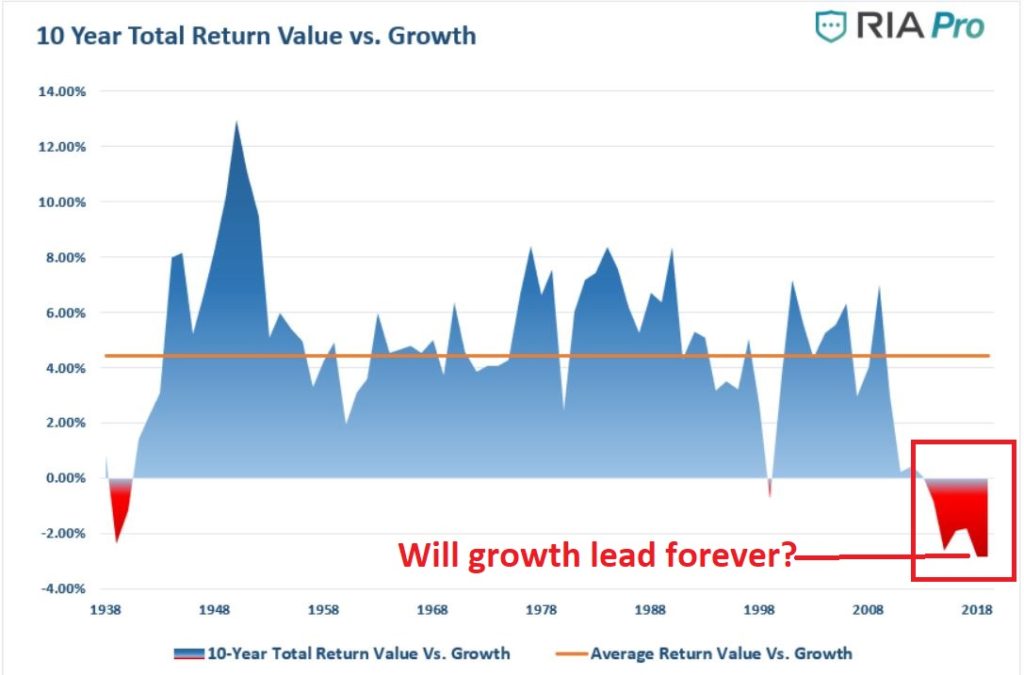
Figure 3 – 10-year value return minus 10-year growth return (Source: RIA Pro)
While at the moment the “Growth is God” banner is flying high, Figure 3 argues pretty strongly that this trend will not last forever. So, enjoy the growth ride while it lasts, but remember that it will end someday.
Commodities versus Stocks
Figure 4 displays the relative performance an index of commodity related stocks to the performance of the S&P 500 Index, going back to the 1930’s. Note that commodity related performance has never been worse relative to stocks.
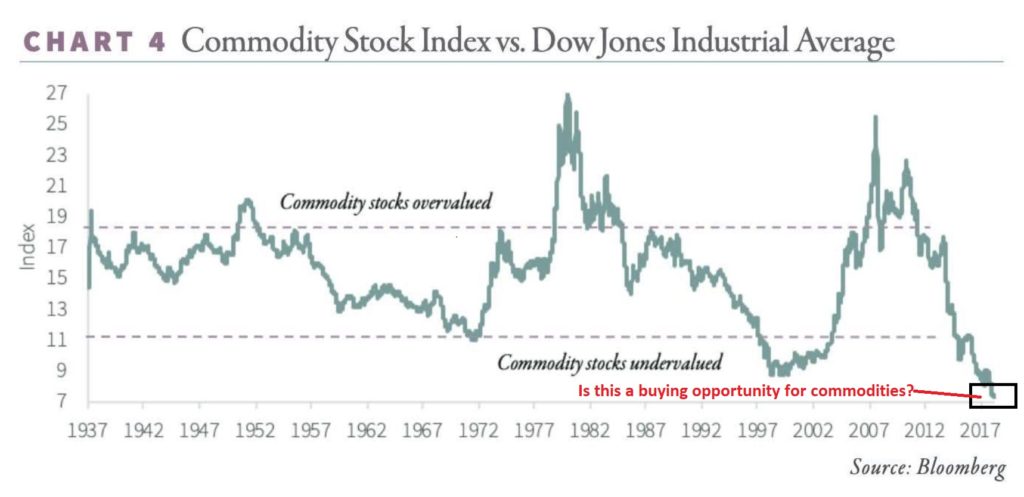
Figure 4 – Commodity related stocks versus the S&P 500 Index.
Once again, trying to pick the exact bottom in this relationship is a mistake. The bigger mistake is assuming this relationship will never reverse.
Summary
Don’t get caught staring at the “shiny object” for too long. The “large-cap/growth/tech/momentum party will likely resume and roll on for who knows how long. But just remember, all good things gotta come to an end.
See also Jay Kaeppel Interview in July 2020 issue of Technical Analysis of Stocks and Commodities magazine
See also Jay’s “A Strategy You Probably Haven’t Considered” Video
See also Video – The Long-Term…Now More Important Than Ever
Jay Kaeppel
Disclaimer: The information, opinions and ideas expressed herein are for informational and educational purposes only and are based on research conducted and presented solely by the author. The information presented represents the views of the author only and does not constitute a complete description of any investment service. In addition, nothing presented herein should be construed as investment advice, as an advertisement or offering of investment advisory services, or as an offer to sell or a solicitation to buy any security. The data presented herein were obtained from various third-party sources. While the data is believed to be reliable, no representation is made as to, and no responsibility, warranty or liability is accepted for the accuracy or completeness of such information. International investments are subject to additional risks such as currency fluctuations, political instability and the potential for illiquid markets. Past performance is no guarantee of future results. There is risk of loss in all trading. Back tested performance does not represent actual performance and should not be interpreted as an indication of such performance. Also, back tested performance results have certain inherent limitations and differs from actual performance because it is achieved with the benefit of hindsight.

