In this article, dated 7/10/2020, I noted that my “Stuff” Index was coming on strong and that its performance may be a “shot across the bow” that some changes may be coming to the financial markets. Since then, the trend has accelerated.
STUFF vs. FANG vs. QQQ
Figure 1 displays the performance of STUFF components since 7/10
Figure 2 displays the performance of FANG components since 7/10

Figure 1 – Price performance of Jay’s STUFF Index components since 7/10

Figure 2 – Price performance of FANG stocks since 7/10
For the record, the “high-flying” Nasdaq 100 Index (using ticker QQQ as a proxy investment) is up +4.0% during the same time.
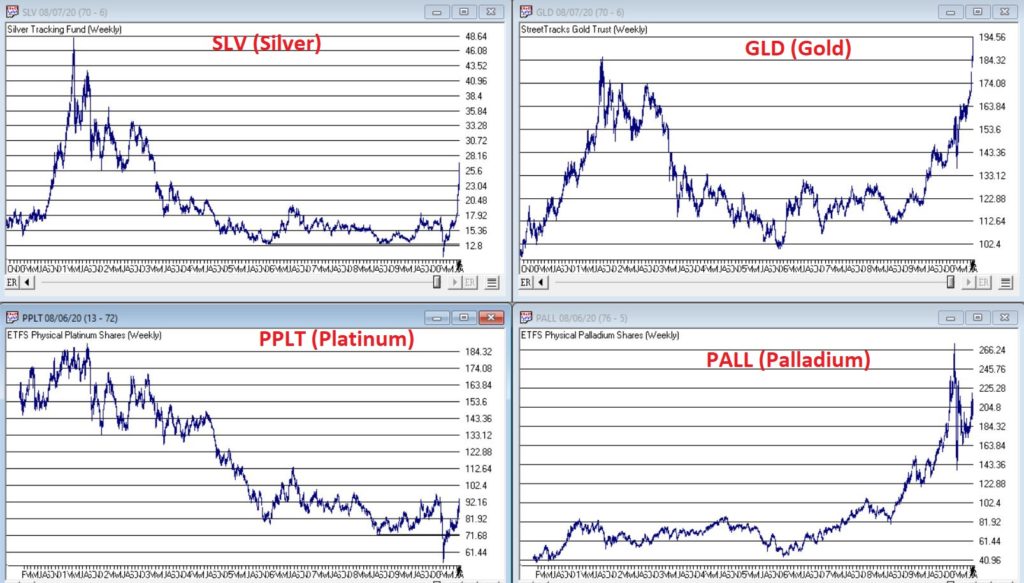
Is this a trend – or a blip? Unfortunately, I can’t answer that question. But it certainly appears that there is something afoot in “Stuff”, particularly the metals. Figure 3 displays the weekly charts for ETFs tracking Silver, Gold, Palladium and Platinum (clockwise from upper left).

Figure 3 – The metals components of the Stuff Index (Courtesy AIQ TradingExpert)
When it comes bull markets in metals, the typical pattern historically goes something like this:
*Gold leads the way (check)
*Eventually silver comes on strong and often ends up outperforming gold (check)
*The other metals rise significantly “under the radar” as everyone focus on – literally in this case, ironically – the “shiny objects” (gold and silver)
Again, while I had inklings that a bull market in metals was forming (and have held positions in them for several years, and still hold them), I certainly did not “predict” the recent explosion in gold and silver prices.
Two things to note:
*Gold and silver are obviously very “overbought”, so buying a large position here entails significant risk
*Still it should be noted that both SLV and PPLT would have to double in price from their current levels just to get back to their previous all-time highs of 2011
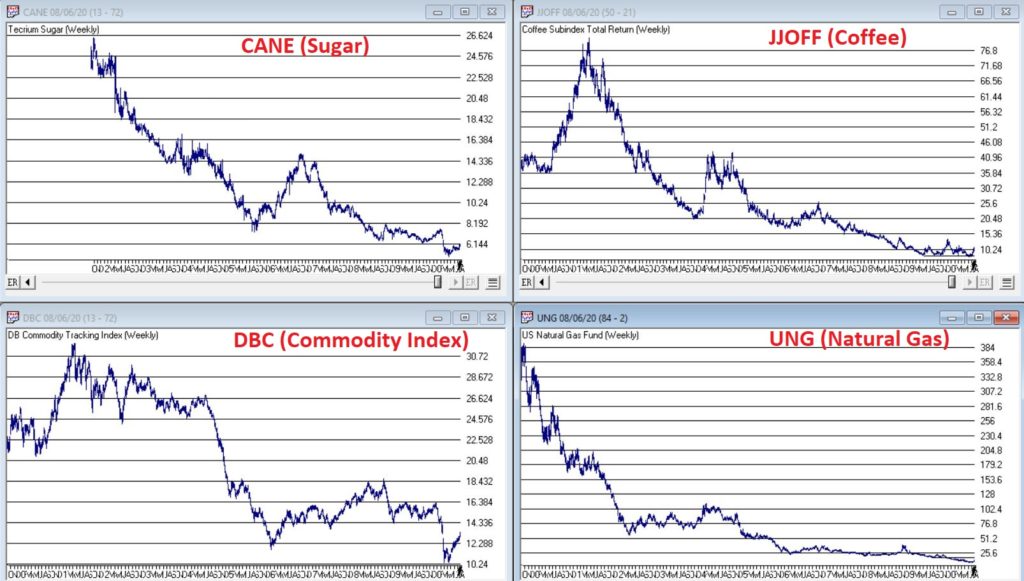
So, don’t be surprised if “Stuff” enjoys a continued resurgence. Note in Figure 4 that a number of commodity related ETFs are way, way beaten down and could have a lot of upside potential if a resurgence actually does unfold.

Figure 4 – Four commodity ETFs weekly (Courtesy AIQ TradingExpert)
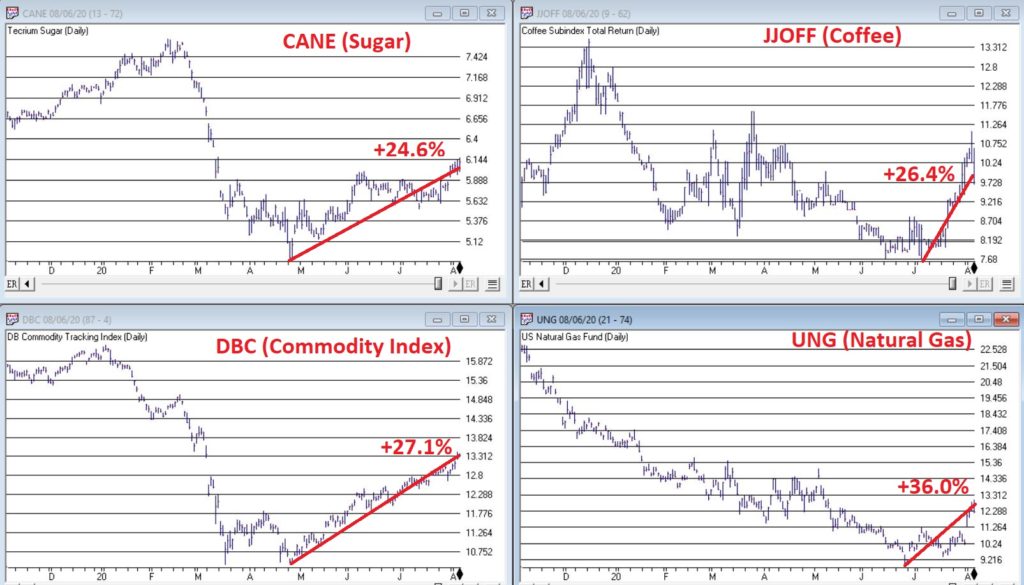
What is interesting – and almost not visible to the naked eye – is the action in the lower right hand corner of these four charts. To highlight what is “hiding in plain sight”, Figure 5 “zooms in” on the recent action of same four tickers as Figure 4, but in a daily price format rather than a monthly price format.

Figure 5 – Four commodity ETFs daily (Courtesy AIQ TradingExpert)
Despite the ugly pictures painted in Figure 4, it is interesting to note in Figure 5 that all four of these commodity related ETFs have rallied sharply of late. There is of course, no guarantee this will continue. But if the rally in “Stuff” – currently led by metals – spreads to the commodity sector as a whole, another glance in Figures 3 and 4 reveals a lot of potential upside opportunity.
Time will tell. In the meantime, keep an eye on the “shiny objects” (gold and silver) for clues as to whether or not the rally in “Stuff” has staying power.
See also Jay Kaeppel Interview in July 2020 issue of Technical Analysis of Stocks and Commodities magazine
See also Jay’s “A Strategy You Probably Haven’t Considered” Video
See also Video – The Long-Term…Now More Important Than Ever
Jay Kaeppel
Disclaimer: The information, opinions and ideas expressed herein are for informational and educational purposes only and are based on research conducted and presented solely by the author. The information presented represents the views of the author only and does not constitute a complete description of any investment service. In addition, nothing presented herein should be construed as investment advice, as an advertisement or offering of investment advisory services, or as an offer to sell or a solicitation to buy any security. The data presented herein were obtained from various third-party sources. While the data is believed to be reliable, no representation is made as to, and no responsibility, warranty or liability is accepted for the accuracy or completeness of such information. International investments are subject to additional risks such as currency fluctuations, political instability and the potential for illiquid markets. Past performance is no guarantee of future results. There is risk of loss in all trading. Back tested performance does not represent actual performance and should not be interpreted as an indication of such performance. Also, back tested performance results have certain inherent limitations and differs from actual performance because it is achieved with the benefit of hindsight.


Jay, I have the answer to your 40-week cycle study. Please contact me asap.