It is not exactly a secret that the start of a meaningful bull market is more often than not marked by a “thrust” higher. The best way to measure thrust historically has not been price, but advances versus declines (and also in many cases up volume versus down volume).
An Example Using OTC Stocks
I follow the daily action of advances and declines for the Nasdaq market. Here is what to look for in terms of “bull market thrusts” (WARNING: these signals don’t occur often):
A = Total # of daily advancing stocks recorded over the past 10 days
B = Total # of daily declining stock recorded over the past 10 days
C = (A / (A + B)) *100
If C is 61% or greater, you have a “Bull Market Thrust”
In English, if 61% or more of the advances plus declines over the past 10 trading days have been advances we have a “Bull Market Thrust”.
Results
*For performance measurement purposes we will use ticker FOCPX (Fidelity OTC Fund)
*When a bull market thrust occurs, we will hold FOCPX for 252 trading days (roughly a year)
*Tabular results appear in Figure 1
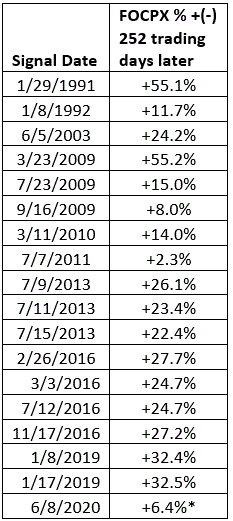
Figure 1 – FOCPX % +(-) 252 trading days after each Bull Market Thrust
As you can see, there are a lot of overlapping signals (i.e., a new signal that occurs within 252 trading days of a previous signal). For trading purposes, when a subsequent overlapping signal occurs, we simply extend the “bullish period” another 252 trading days.
Holding ticker FOCPX ONLY during trading days that are within 252 calendar days of a Bull Market Thrust signal generates the equity curve displayed in Figure 2.
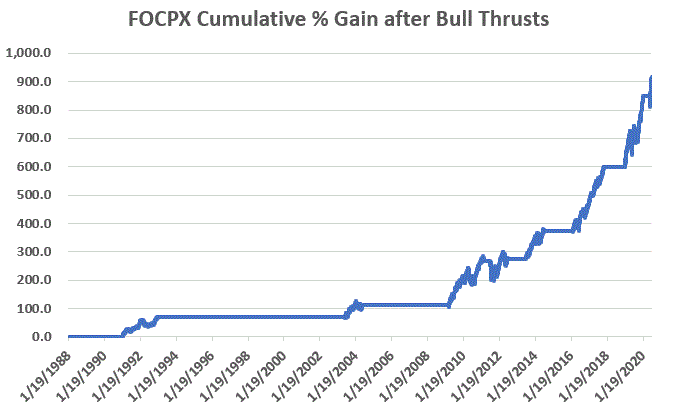
Figure 2 – FOCPX cumulative % return if held 252 trading days after every Bull Market Thrust signal (1991-present)
Figure 3 displays results during each bull market period for the S&P 500 Index, the Nasdaq 100 Index and the OTC Composite Index (NOTE: A bull market period begins when a Bull Market Thrust occurs and lasts at least 252 trading days – but can be extended another 252 trading days if a new Bull Market Thrust signal occurs along the way).
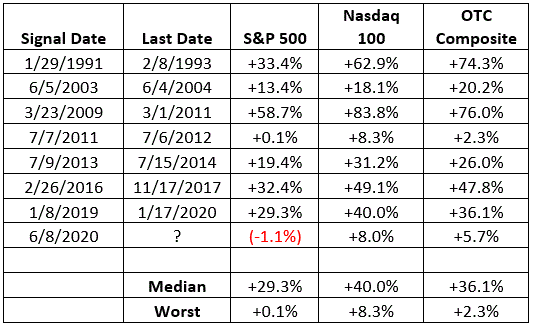
Figure 3 – Index Results during Bull Market Thrust bullish periods
As you can see in Figure 3, in the past 30 years Bull Market Thrusts have marked some pretty good times for stock market investors to, well, be bullish.
Summary
The good news implied by all of this is that investors “should” be bullish on stocks for the next year. At the very least this offers some pretty solid heft to “the weight of the evidence” on the bullish side. The results in these tables and charts suggest investors should be looking at market dips as buying opportunities.
Alas, the bad news is that no indicator/oscillator/signal/system/etc. is ever guaranteed to be right “this time around.” So in terms of real-world trading, risk control remains the top priority.
See also Jay Kaeppel Interview in July 2020 issue of Technical Analysis of Stocks and Commodities magazine
See also Jay’s “A Strategy You Probably Haven’t Considered” Video
See also Video – The Long-Term…Now More Important Than Ever
Jay Kaeppel
Disclaimer: The information, opinions and ideas expressed herein are for informational and educational purposes only and are based on research conducted and presented solely by the author. The information presented represents the views of the author only and does not constitute a complete description of any investment service. In addition, nothing presented herein should be construed as investment advice, as an advertisement or offering of investment advisory services, or as an offer to sell or a solicitation to buy any security. The data presented herein were obtained from various third-party sources. While the data is believed to be reliable, no representation is made as to, and no responsibility, warranty or liability is accepted for the accuracy or completeness of such information. International investments are subject to additional risks such as currency fluctuations, political instability and the potential for illiquid markets. Past performance is no guarantee of future results. There is risk of loss in all trading. Back tested performance does not represent actual performance and should not be interpreted as an indication of such performance. Also, back tested performance results have certain inherent limitations and differs from actual performance because it is achieved with the benefit of hindsight.


One thought on “The Power of Bull Market Thrust”
Comments are closed.