Monthly Archives: June 2020

Track This Leading Indicator for Commodities…

Everyone hates the commodities markets.  That’s a fact – at least if we look at price performance relative to say the S&P 500 Index.  Still, in this article I highlighted my own opinion that commodities are overdue for a period of outperformance.  That doesn’t necessarily mean its going to start today.

There are several implications of all of this:

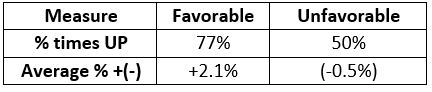
*The chart in Figure 1 divides the performance of the Goldman Sachs Commodity Index by the performance of the S&P 500 Index since 1971. You don’t actually need my commentary to grasp the implication of activity in recent years.  They are practically giving commodities away (again, at least relative to stocks).

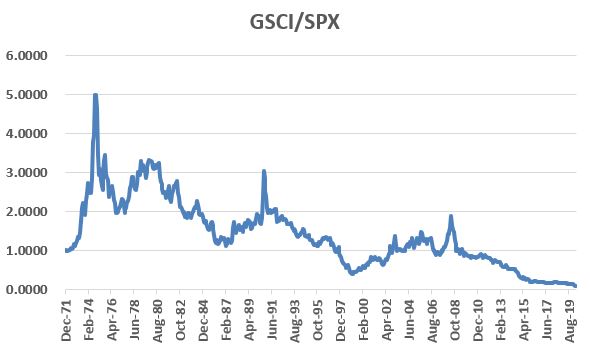
Figure 1 – Goldman Sachs Commodity Index / S&P 500 Index (1971-2020)

*Nevertheless, despite the fact that commodities as an asset class are as beaten down, washed out, unloved as any time in history, that does NOT necessarily mean that now is the time to “load up” (although I personally am not opposed to “accumulating” a few things here and there at what appear to be low prices, rather than waiting for that “one great moment” to dive in head long).

So, what’s an investor to do?  One simple trick might be to keep an eye on the Australian Dollar.  No, seriously. 

Figure 2 displays Aussie Dollar spot futures in the top clip and the CRB Index (an index of commodities) in the bottom clip.  Please note:

*The high correlation between the two, and;

*The slightly leading nature of the Aussies Dollar

Figure 2-Australian Dollar and CRB (commodity) Index (2001-2020) (Courtesy ProfitSource by HUBB)

The Test

*To test long-term results, we will use the same Aussie Dollar spot futures contract in Figure 2 versus its 24-month exponential moving average (also plotted in Figure 1).

*To measure commodity performance we will use the monthly total return for the Goldman Sachs Commodity Index (GSCI)

 *When the Aussie Dollar closes above its 24-month EMA we will buy and hold the Goldman Sachs Commodity Index (GSCI).

*We will also track the performance of the GSCI when the Aussie Dollar is below its 24-month EMA.

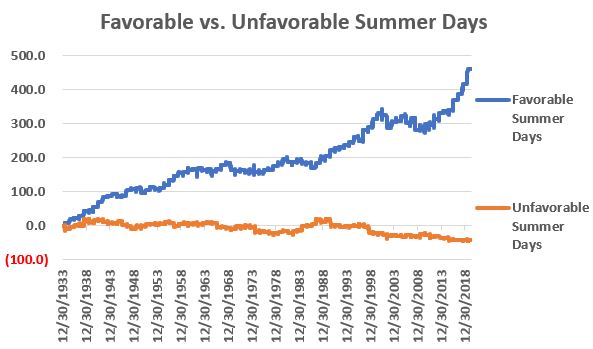
Figure 3 displays the growth of equity from holding the GSCI when the Aussies Dollar is above its 24-month EMA. 

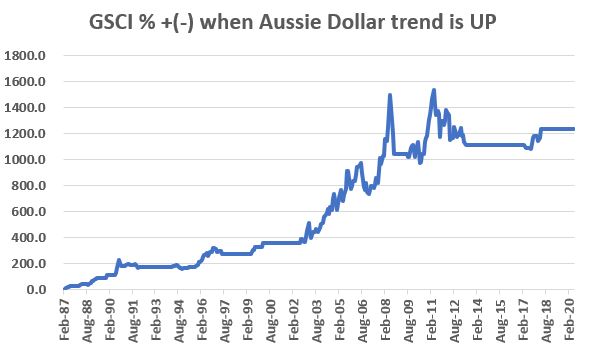
Figure 3 – GSCI Cumulative +(-) when Aussie Dollar > 24-month EMA (1987-2020)

Figure 4 displays the growth of equity from holding the GSCI when the Aussie Dollar is below its 24-month EMA. 

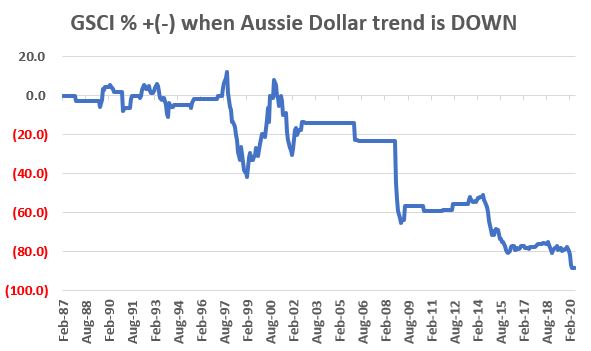
Figure 4 – GSCI Cumulative +(-) when Aussie Dollar < 24-month EMA (1987-2020)

The Results

From January 1987 through April 2020:

*The cumulative gain for GSCI when the Aussie Dollar > 24-mo. EMA was +1,234%

*The cumulative loss for GSCI when the Aussie Dollar < 24-mo. EMA was -88%

The bottom line: avoiding commodities when the Aussie Dollar is trending lower sounds like a good idea.

A Real-World Application

A simpler approach to tracking the Aussies Dollar might be to follow ticker FXA (an ETF that tracks the Aussie Dollar) versus its 24-month EMA. Also, ticker GSG is an ETF that tracks the Goldman Sachs Commodity Index, which can be used for actually trading an index comprised of a basket of commodities. 

A trader could consider going long GSG when FXA is above its 24-month EMA and possibly selling short GSG when FXA is below its 24-month EMA.

Figure 5 displays the returns for GSG during both bullish (i.e., FXA > 24-month EMA) and bearish (i.e., FXA < 24-month EMA) periods since GSG started trading in 2006.

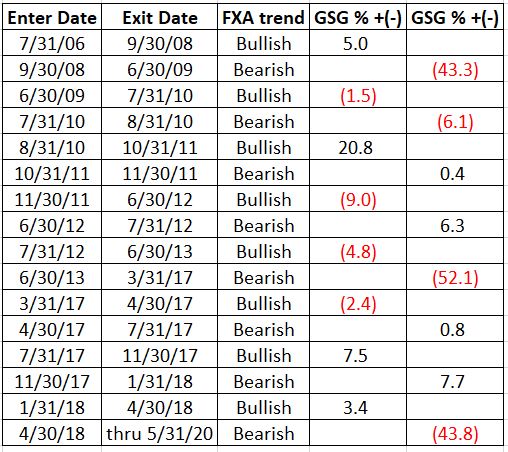
Figure 5 – Ticker GSG performance based on FXA trend

What to Watch For

The trend for FXA has been bearish since 4/30/2018 and remains so today.  As I write, FXA is at $67.69 a share and the 24-month EMA is at $68.63.  If FXA closes June above its 24-month EMA then a bullish signal for commodities in general – and GSG in particular – would occur. 

So for now, this “model” (such as it is) remains “bearish” for commodities. But the Aussie Dollar has rallied strongly off of its March lows, so now is the time to be “paying attention.”

For the record, I am not suggesting that anyone should buy or sell commodities based solely on the action of one indicator. But as a trend indicator for commodities, the Australian Dollar has historically shown itself to be useful.

See also Jay’s “A Strategy You Probably Haven’t Considered” Video

See also Video – The Long-Term…Now More Important Than Ever

Jay Kaeppel

Disclaimer: The information, opinions and ideas expressed herein are for informational and educational purposes only and are based on research conducted and presented solely by the author.  The information presented represents the views of the author only and does not constitute a complete description of any investment service.  In addition, nothing presented herein should be construed as investment advice, as an advertisement or offering of investment advisory services, or as an offer to sell or a solicitation to buy any security.  The data presented herein were obtained from various third-party sources.  While the data is believed to be reliable, no representation is made as to, and no responsibility, warranty or liability is accepted for the accuracy or completeness of such information.  International investments are subject to additional risks such as currency fluctuations, political instability and the potential for illiquid markets.  Past performance is no guarantee of future results.  There is risk of loss in all trading.  Back tested performance does not represent actual performance and should not be interpreted as an indication of such performance.  Also, back tested performance results have certain inherent limitations and differs from actual performance because it is achieved with the benefit of hindsight.

Biotech and Gold Stocks – The Odd Couple

There are a lot of things that don’t make sense these days.  In fact, where would one even begin? So let’s move past all of that and look at something else that doesn’t seem to make sense one the face of it – i.e., the “Odd Couple” relationship between biotech and gold stocks.

The BIOGOLD Index

Using AIQ TradingExpert software I created my own “index” called “BIOGOLD” that simply combines ticker FBIOX (Fidelity Select Biotech) and ticker FSAGX (Fidelity Select Gold).  The index appears in Figure 1.

Figure 1 – Jay’s BIOGOLD Index (Courtesy AIQ TradingExpert)

Also included in the lower clip is an indicator referred to as Monthly RSI32, which is the 2-period average of the standard 3-period RSI. The levels of 65, 50 and 35 are highlighted in red for reasons detailed below.

The Rules

For the record, I have changed “the rules” a few times over the years.  Call it curve-fitting if you’d like, but the goal is to generate the timeliest signals.  The rules now are as follows:

A “buy signal” occurs when either:

*The Monthly RSI32 drops to 35 or below

*The Monthly RSI32 drops below 50 (but not as low as 35) and then reverses to the upside for one month

After either of the buy signals above occurs, buy BOTH FBIOX and FSAGX

*After a buy signal, sell both funds when Monthly RSI32 rises to 64 or higher

To test results, we will:

*Assume that after a buy signal both FBIOX and FSAGX are bought in equal amounts

*We will assume that both funds are held until Monthly RSI32 reaches 64 or higher (i.e., there is no stop-loss provision in this test)

For testing purposes, we will not assume any interest earned while out of the market, in order to highlight only the performance during active buy signals. Figure 2 displays the hypothetical growth of $1,000 (using monthly total return data) using the “system”.

NOTE: All results are generated using total monthly return data for FBIOX and FSAGX, except for May 2020 which is based on price action only (my source of total return data does not update until sometime in June).

Figure 2 – Cumulative hypothetical % growth using Jay’s BIOGOLD System (1986-present)

*The most recent BUY signal occurred at the end of March 2020 when the RSI32 indicator for BIOGOLD closed at 33.67.

*The most recent SELL signal occurred at the end of May 2020 when the RSI32 indicator for BIOGOLD closed at 76.96.

Figures 3 and 4 display the price action for FBIOX and FSAGX during this two-month period.

Figure 3 – Ticker FBIOX (Courtesy AIQ TradingExpert)

Figure 4 – Ticker FSAGX (Courtesy AIQ TradingExpert)

Summary

Is this really a viable approach to investing?  That’s not for me to say.  But it seems to do a pretty good job of identifying favorable times to be in with that “Odd Couple” of biotech and gold. So there’s that…

See also Jay’s “A Strategy You Probably Haven’t Considered” Video

See also Video – The Long-Term…Now More Important Than Ever

Jay Kaeppel

Disclaimer: The information, opinions and ideas expressed herein are for informational and educational purposes only and are based on research conducted and presented solely by the author.  The information presented represents the views of the author only and does not constitute a complete description of any investment service.  In addition, nothing presented herein should be construed as investment advice, as an advertisement or offering of investment advisory services, or as an offer to sell or a solicitation to buy any security.  The data presented herein were obtained from various third-party sources.  While the data is believed to be reliable, no representation is made as to, and no responsibility, warranty or liability is accepted for the accuracy or completeness of such information.  International investments are subject to additional risks such as currency fluctuations, political instability and the potential for illiquid markets.  Past performance is no guarantee of future results.  There is risk of loss in all trading.  Back tested performance does not represent actual performance and should not be interpreted as an indication of such performance.  Also, back tested performance results have certain inherent limitations and differs from actual performance because it is achieved with the benefit of hindsight.

22 Days to a Better Summer

Let’s face it, some days are better than others.  This is true in life.  It also appears to be true in the stock market, especially during the summer months of June, July and August.

Let’s break it down.

The Summer Rally

We will designate two periods as comprising the quote, unquote “Summer Rally.”

*June Trading Day #1 through June Trading Day #10 (10 trading days)

*The last 3 trading days of June through July Trading Day #9 (12 trading days)

These 22 trading days are considered “Favorable”

*All other trading days are considered “Unfavorable”

Figure 1 displays the cumulative price

Figure 1 – Cumulative Dow price % +(-) for “Favorable” versus “Unfavorable” summer days (1934-2019)

In a nutshell:

*Cumulative Dow price gain during “Favorable” days = +460.1%

*Cumulative Dow price decline during “Unfavorable” days = (-42.4%)

Figure 2 displays the comparative performance for “Favorable” versus “Unfavorable” summer days since 1934.

Figure 2 – Comparative Results; 1934-2019

Summary

Three things:

#1. The stock market “typically” sees strength at the very beginning of June and July and also at the very end of June.  The rest of the summer months of June, July and August has a pretty spotty history.

#2. Beyond “typical trends” be aware that from year-to-year results can vary greatly (Figure 3 at the end of this article displays year-by-year results).

#3. As you can see in Figure 3 below, the “Favorable” summer period has showed a gain in each of the past 8 years and in 10 of the last 11.  Over the long-term the winning percentage is 77%. 

See also Video – The Long-Term…Now More Important Than Ever

Year Favorable Unfavorable Difference
1934 9.4 (7.8) 17.2
1935 9.7 5.3 4.4
1936 3.3 5.5 (2.2)
1937 3.4 (1.8) 5.2
1938 11.7 15.7 (4.0)
1939 1.8 (4.5) 6.3
1940 6.1 4.9 1.2
1941 9.6 0.6 9.0
1942 9.8 (4.0) 13.8
1943 0.8 (4.6) 5.3
1944 2.6 0.7 1.9
1945 (2.4) 6.1 (8.4)
1946 (0.1) (10.8) 10.7
1947 10.0 (4.0) 14.0
1948 1.5 (6.1) 7.6
1949 0.1 6.1 (6.0)
1950 (5.9) 3.1 (9.0)
1951 4.1 3.2 0.9
1952 3.9 0.7 3.2
1953 (2.5) (1.6) (1.0)
1954 0.9 1.7 (0.8)
1955 5.1 4.8 0.3
1956 6.1 (1.0) 7.1
1957 5.2 (8.8) 13.9
1958 3.8 5.9 (2.2)
1959 0.6 2.6 (2.0)
1960 2.9 (2.7) 5.6
1961 0.9 2.4 (1.5)
1962 1.1 (1.8) 2.9
1963 (1.9) 2.2 (4.1)
1964 0.6 1.6 (1.0)
1965 (2.2) (0.6) (1.6)
1966 2.0 (12.6) 14.6
1967 4.8 0.9 3.9
1968 2.7 (2.9) 5.6
1969 (7.9) (3.1) (4.9)
1970 (1.0) 10.2 (11.2)
1971 1.6 (2.7) 4.3
1972 (2.8) 3.2 (6.0)
1973 0.9 (2.4) 3.3
1974 (0.2) (15.3) 15.1
1975 (0.6) 1.0 (1.5)
1976 2.2 (2.3) 4.5
1977 0.6 (4.7) 5.4
1978 4.5 (0.1) 4.6
1979 1.9 5.9 (4.0)
1980 5.1 4.3 0.8
1981 (3.5) (7.9) 4.4
1982 0.9 9.0 (8.0)
1983 0.2 1.2 (1.0)
1984 (1.8) 12.8 (14.6)
1985 0.1 1.3 (1.3)
1986 (5.0) 6.5 (11.4)
1987 5.0 10.6 (5.6)
1988 4.9 (4.6) 9.5
1989 2.1 8.1 (6.1)
1990 6.7 (14.8) 21.6
1991 1.5 (1.0) 2.5
1992 1.0 (5.0) 6.0
1993 1.1 2.4 (1.3)
1994 3.0 1.1 1.9
1995 4.3 (1.0) 5.2
1996 (3.5) 3.2 (6.7)
1997 9.4 (4.9) 14.3
1998 2.7 (17.5) 20.2
1999 5.7 (3.0) 8.6
2000 4.6 1.9 2.6
2001 (1.4) (7.5) 6.1
2002 (9.2) (3.9) (5.3)
2003 4.9 1.4 3.5
2004 0.3 (0.4) 0.7
2005 4.1 (3.8) 7.9
2006 (4.8) 7.0 (11.8)
2007 3.7 (5.5) 9.2
2008 (8.9) 0.2 (9.1)
2009 2.1 9.4 (7.2)
2010 2.7 (3.8) 6.6
2011 (0.8) (6.9) 6.1
2012 4.1 1.5 2.6
2013 4.5 (6.2) 10.7
2014 1.5 0.8 0.7
2015 0.3 (8.5) 8.8
2016 7.3 (3.6) 10.9
2017 3.3 1.1 2.2
2018 6.2 0.1 6.1
2019 8.2 (1.7) 9.9

Figure 3 – Year-by-Year % Dow price return during “Favorable” summer days versus “Unfavorable” summer days

Jay Kaeppel

Disclaimer: The information, opinions and ideas expressed herein are for informational and educational purposes only and are based on research conducted and presented solely by the author.  The information presented represents the views of the author only and does not constitute a complete description of any investment service.  In addition, nothing presented herein should be construed as investment advice, as an advertisement or offering of investment advisory services, or as an offer to sell or a solicitation to buy any security.  The data presented herein were obtained from various third-party sources.  While the data is believed to be reliable, no representation is made as to, and no responsibility, warranty or liability is accepted for the accuracy or completeness of such information.  International investments are subject to additional risks such as currency fluctuations, political instability and the potential for illiquid markets.  Past performance is no guarantee of future results.  There is risk of loss in all trading.  Back tested performance does not represent actual performance and should not be interpreted as an indication of such performance.  Also, back tested performance results have certain inherent limitations and differs from actual performance because it is achieved with the benefit of hindsight.