Let’s face it, some days are better than others. This is true in life. It also appears to be true in the stock market, especially during the summer months of June, July and August.
Let’s break it down.
The Summer Rally
We will designate two periods as comprising the quote, unquote “Summer Rally.”
*June Trading Day #1 through June Trading Day #10 (10 trading days)
*The last 3 trading days of June through July Trading Day #9 (12 trading days)
These 22 trading days are considered “Favorable”
*All other trading days are considered “Unfavorable”
Figure 1 displays the cumulative price
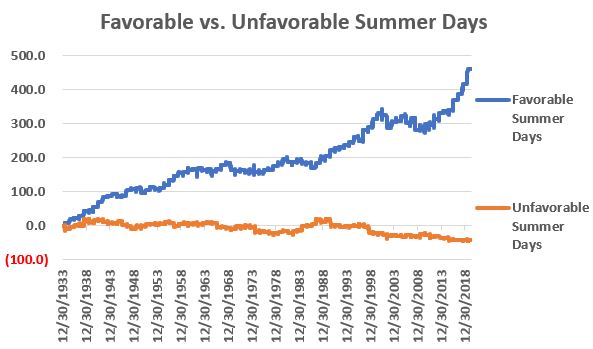
Figure 1 – Cumulative Dow price % +(-) for “Favorable” versus “Unfavorable” summer days (1934-2019)
In a nutshell:
*Cumulative Dow price gain during “Favorable” days = +460.1%
*Cumulative Dow price decline during “Unfavorable” days = (-42.4%)
Figure 2 displays the comparative performance for “Favorable” versus “Unfavorable” summer days since 1934.
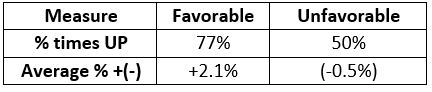
Figure 2 – Comparative Results; 1934-2019
Summary
Three things:
#1. The stock market “typically” sees strength at the very beginning of June and July and also at the very end of June. The rest of the summer months of June, July and August has a pretty spotty history.
#2. Beyond “typical trends” be aware that from year-to-year results can vary greatly (Figure 3 at the end of this article displays year-by-year results).
#3. As you can see in Figure 3 below, the “Favorable” summer period has showed a gain in each of the past 8 years and in 10 of the last 11. Over the long-term the winning percentage is 77%.
See also Video – The Long-Term…Now More Important Than Ever
| Year | Favorable | Unfavorable | Difference |
| 1934 | 9.4 | (7.8) | 17.2 |
| 1935 | 9.7 | 5.3 | 4.4 |
| 1936 | 3.3 | 5.5 | (2.2) |
| 1937 | 3.4 | (1.8) | 5.2 |
| 1938 | 11.7 | 15.7 | (4.0) |
| 1939 | 1.8 | (4.5) | 6.3 |
| 1940 | 6.1 | 4.9 | 1.2 |
| 1941 | 9.6 | 0.6 | 9.0 |
| 1942 | 9.8 | (4.0) | 13.8 |
| 1943 | 0.8 | (4.6) | 5.3 |
| 1944 | 2.6 | 0.7 | 1.9 |
| 1945 | (2.4) | 6.1 | (8.4) |
| 1946 | (0.1) | (10.8) | 10.7 |
| 1947 | 10.0 | (4.0) | 14.0 |
| 1948 | 1.5 | (6.1) | 7.6 |
| 1949 | 0.1 | 6.1 | (6.0) |
| 1950 | (5.9) | 3.1 | (9.0) |
| 1951 | 4.1 | 3.2 | 0.9 |
| 1952 | 3.9 | 0.7 | 3.2 |
| 1953 | (2.5) | (1.6) | (1.0) |
| 1954 | 0.9 | 1.7 | (0.8) |
| 1955 | 5.1 | 4.8 | 0.3 |
| 1956 | 6.1 | (1.0) | 7.1 |
| 1957 | 5.2 | (8.8) | 13.9 |
| 1958 | 3.8 | 5.9 | (2.2) |
| 1959 | 0.6 | 2.6 | (2.0) |
| 1960 | 2.9 | (2.7) | 5.6 |
| 1961 | 0.9 | 2.4 | (1.5) |
| 1962 | 1.1 | (1.8) | 2.9 |
| 1963 | (1.9) | 2.2 | (4.1) |
| 1964 | 0.6 | 1.6 | (1.0) |
| 1965 | (2.2) | (0.6) | (1.6) |
| 1966 | 2.0 | (12.6) | 14.6 |
| 1967 | 4.8 | 0.9 | 3.9 |
| 1968 | 2.7 | (2.9) | 5.6 |
| 1969 | (7.9) | (3.1) | (4.9) |
| 1970 | (1.0) | 10.2 | (11.2) |
| 1971 | 1.6 | (2.7) | 4.3 |
| 1972 | (2.8) | 3.2 | (6.0) |
| 1973 | 0.9 | (2.4) | 3.3 |
| 1974 | (0.2) | (15.3) | 15.1 |
| 1975 | (0.6) | 1.0 | (1.5) |
| 1976 | 2.2 | (2.3) | 4.5 |
| 1977 | 0.6 | (4.7) | 5.4 |
| 1978 | 4.5 | (0.1) | 4.6 |
| 1979 | 1.9 | 5.9 | (4.0) |
| 1980 | 5.1 | 4.3 | 0.8 |
| 1981 | (3.5) | (7.9) | 4.4 |
| 1982 | 0.9 | 9.0 | (8.0) |
| 1983 | 0.2 | 1.2 | (1.0) |
| 1984 | (1.8) | 12.8 | (14.6) |
| 1985 | 0.1 | 1.3 | (1.3) |
| 1986 | (5.0) | 6.5 | (11.4) |
| 1987 | 5.0 | 10.6 | (5.6) |
| 1988 | 4.9 | (4.6) | 9.5 |
| 1989 | 2.1 | 8.1 | (6.1) |
| 1990 | 6.7 | (14.8) | 21.6 |
| 1991 | 1.5 | (1.0) | 2.5 |
| 1992 | 1.0 | (5.0) | 6.0 |
| 1993 | 1.1 | 2.4 | (1.3) |
| 1994 | 3.0 | 1.1 | 1.9 |
| 1995 | 4.3 | (1.0) | 5.2 |
| 1996 | (3.5) | 3.2 | (6.7) |
| 1997 | 9.4 | (4.9) | 14.3 |
| 1998 | 2.7 | (17.5) | 20.2 |
| 1999 | 5.7 | (3.0) | 8.6 |
| 2000 | 4.6 | 1.9 | 2.6 |
| 2001 | (1.4) | (7.5) | 6.1 |
| 2002 | (9.2) | (3.9) | (5.3) |
| 2003 | 4.9 | 1.4 | 3.5 |
| 2004 | 0.3 | (0.4) | 0.7 |
| 2005 | 4.1 | (3.8) | 7.9 |
| 2006 | (4.8) | 7.0 | (11.8) |
| 2007 | 3.7 | (5.5) | 9.2 |
| 2008 | (8.9) | 0.2 | (9.1) |
| 2009 | 2.1 | 9.4 | (7.2) |
| 2010 | 2.7 | (3.8) | 6.6 |
| 2011 | (0.8) | (6.9) | 6.1 |
| 2012 | 4.1 | 1.5 | 2.6 |
| 2013 | 4.5 | (6.2) | 10.7 |
| 2014 | 1.5 | 0.8 | 0.7 |
| 2015 | 0.3 | (8.5) | 8.8 |
| 2016 | 7.3 | (3.6) | 10.9 |
| 2017 | 3.3 | 1.1 | 2.2 |
| 2018 | 6.2 | 0.1 | 6.1 |
| 2019 | 8.2 | (1.7) | 9.9 |
Figure 3 – Year-by-Year % Dow price return during “Favorable” summer days versus “Unfavorable” summer days
Jay Kaeppel
Disclaimer: The information, opinions and ideas expressed herein are for informational and educational purposes only and are based on research conducted and presented solely by the author. The information presented represents the views of the author only and does not constitute a complete description of any investment service. In addition, nothing presented herein should be construed as investment advice, as an advertisement or offering of investment advisory services, or as an offer to sell or a solicitation to buy any security. The data presented herein were obtained from various third-party sources. While the data is believed to be reliable, no representation is made as to, and no responsibility, warranty or liability is accepted for the accuracy or completeness of such information. International investments are subject to additional risks such as currency fluctuations, political instability and the potential for illiquid markets. Past performance is no guarantee of future results. There is risk of loss in all trading. Back tested performance does not represent actual performance and should not be interpreted as an indication of such performance. Also, back tested performance results have certain inherent limitations and differs from actual performance because it is achieved with the benefit of hindsight.


On June TD#1 the Dow opened at 25300, today (June TD#10) we are slightly below that.
My gut feeling told me to sell everything on TD#5 around 27000 with 6% profit. Long live the gut feeling 🙂
I am eager to see what the second suggested period has to offer.