Part I highlighted a simple way to decide whether to favor U.S. stocks or international stocks based on a simple momentum measure. In Part II we will add another factor – seasonality – and see what impact that has on results.
(NOTE: Please keep your eyes peeled for the July 2020 issue of Technical Analysis of Stocks & Commodities – due out around June 11 – which will feature an interview with yours truly).
Seasonality – The Power Zone
As I wrote about in this article (and as based on the original work of Yale Hirsch, founder of The Stock Trader’s Almanac nearly 50 years ago) the stock market has showed a long history of performing better between November and April (we will refer to it as the “Power Zone”) than between May through October (the “Dead Zone”).
The Updated U.S./International Strategy
Data Used
*S&P 500 Index monthly total return
*MSCI EAFE Index monthly total return
*Bloomberg Barclay’s Intermediate Treasury Index
*January 1975 through April 2020
If the month is between November and April:
*If the latest 36-month period return for SPX is greater than the 36-month period return for EAFE then hold SPX next month
*If the latest 36-month period return for EAFE is greater than the 36-month period return for SPX then hold EAFE next month
NOTE: I am using monthly total return data, which is not compiled until early in the next month. So, for strategy performance results I use a 1-month lag as follows – the calculation for the end of January actually takes place sometime in early February, so if a switch from one index to the other is indicated based on data through January then that trade is made at the close of the last trading day of February.
If the month is between May and October:
*Hold the Bloomberg Barclay’s Intermediate Treasury Index
Results
As a benchmark we will using a “Split” strategy that allocated 50% to SPX and 50% to EAFE at the first of every year.
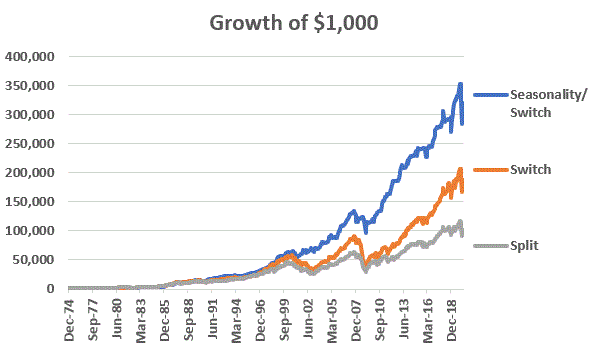
Figure 1 displays the comparative growth of $1,000 using the:
*“Seasonality/Switch” strategy detailed above (blue line)
*”Switch” strategy detailed in Part I (orange line)
*“Split” approach (buying and holding SPX and EAFE with an annual rebalance-grey line)

Figure 1 – Growth of $1,000 using “Seasonality+Switch” strategy versus “Switch” strategy and “Split” strategy (1975-2020)

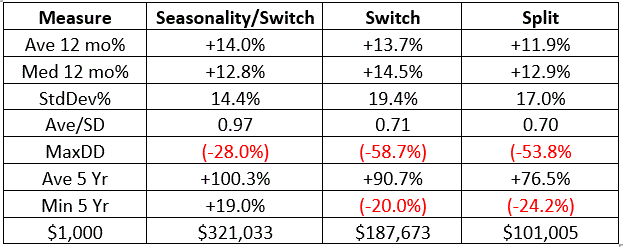
Figure 2 – Comparative Facts and Figures (1975-2020)
Analysis
The Seasonality/Switch strategy:
*Gained +32,003% versus +18,667% for the Switch Strategy and +10,001% for Split
*Witnessed a maximum drawdown of -28.0% versus more than -50% for the other two strategies
*Showed a minimum 5-year cumulative % return of +19.0% versus more than 02-% for the other two strategies
Summary
Is the Seasonality/Switch Strategy the “Be all, end all” of investment strategies? Certainly not. But in terms of simplicity and performance – in the immortal words of my friend from New Jersey:
“I seen woise.”
See also Jay’s “A Strategy You Probably Haven’t Considered” Video
See also Video – The Long-Term…Now More Important Than Ever
Jay Kaeppel
Disclaimer: The information, opinions and ideas expressed herein are for informational and educational purposes only and are based on research conducted and presented solely by the author. The information presented represents the views of the author only and does not constitute a complete description of any investment service. In addition, nothing presented herein should be construed as investment advice, as an advertisement or offering of investment advisory services, or as an offer to sell or a solicitation to buy any security. The data presented herein were obtained from various third-party sources. While the data is believed to be reliable, no representation is made as to, and no responsibility, warranty or liability is accepted for the accuracy or completeness of such information. International investments are subject to additional risks such as currency fluctuations, political instability and the potential for illiquid markets. Past performance is no guarantee of future results. There is risk of loss in all trading. Back tested performance does not represent actual performance and should not be interpreted as an indication of such performance. Also, back tested performance results have certain inherent limitations and differs from actual performance because it is achieved with the benefit of hindsight.

