Intermarket analysis can be an interesting source of ideas. For example, who would guess that there is a relationship between the metals markets and the bond market? At first blush it doesn’t make sense. On one side you have hard, physical metals that have to be dug out of the ground via the use of heavy machinery and mining equipment and on the other side you have pieces of paper issued by governments or companies promising to pay interest over a set period of time and principal at the end. Not exactly apples and apples.
So why would there be any connection? The one thing that connects metals and bonds is inflation/deflation, as this can impact both.
In the simplest terms possible:
*In inflationary times, hard assets such as metals tend to gain ground and paper assets paying a fixed amount of interest tend to lose ground
*In disinflationary and/or deflationary times, hard assets such as metals tend to gain ground and paper assets paying a fixed amount of interest tend to lose ground
Using the Gold/Silver Ratio to Time the Bond Market
The Gold/Silver Ratio (GSR) is exactly as it sounds – the price of gold divided by the price of silver. For our purposes we will measure this on a weekly basis. We will then use treasury bond futures to measure bond performance.
A = Gold/Silver
B = 2-week exponential moving average of A
C = 28-week exponential moving average of A
D = B-C
So D is the difference between the 2-week and the 28-week exponential average
If D is > 0 it tells use that the gold/silver ratio is trending higher
If D is < 0 it tells us that the gold/silver ratio is trending lower
Figure 1 displays the raw Gold/Silver Ratio since 1975 on a weekly basis.

Figure 1 – Gold/Silver Ratio (1975-2020)
Figure 2 displays the GSR 2-week EMA minus the GSR 28-week EMA (i.e., Value “D” above)

Figure 2 – Gold/Silver Ratio 2-week EMA – Gold/Silver Ratio 28-week MA
Now let’s see if the fluctuations in Figure 2 offer any information about the bond market.
Results
For testing purposes, we will compare the results of holding a long position in t-bond futures when D > 0 versus when D < 0.
T-bond futures are worth $1,000 a point. So, if t-bond futures gain one full point they value increases by $1,000 and if t-bond futures lose one full point the value decreases by $1,000.
Test Period: 9/9/1977 through 5/1/2020
Figure 3 displays the results of our test.

Figure 3 – +(-) from a long one t-bond futures contract position depending on whether GSR 2wk EMA is above or below 28wk EMA (1977-2020)
Figure 4 shows the results in table form.
| Gold/Silver Ratio Measure | T-Bond $ +(-) |
| GSR 2-week EMA – 28-week EMA > 0 | +$150,759 |
| GSR 2-week EMA – 28-week EMA < 0 | (-$53,224) |
Figure 4 – +(-) from a long one t-bond futures contract position depending on whether GSR 2wk EMA is above or below 28wk EMA (1977-2020)
Summary
The bottom line is that:
*The blue equity line in Figure 1 (performance of t-bonds when GSR 2ema-28ema > 0) slopes lower left to upper right
*The orange equity line in Figure 1 (performance of t-bonds when GSR 2ema-28ema < 0) slopes upper left to lower right
This tells us that the Gold/Silver ratio may be useful in identifying the overall trend of the bond market.
The trend has been bullish for bonds since 1/24/20 and remains so at the present time. This will remain the case until silver gains enough ground on gold to flip Value “D” discussed above back into negative territory.
Notes on Calculations
*For the record I use the weekly reading for ticker GC-SPOTV and ticker SI-SPOTV in ProfitSource by HUBB software to make the weekly Gold/silver Ratio calculation.
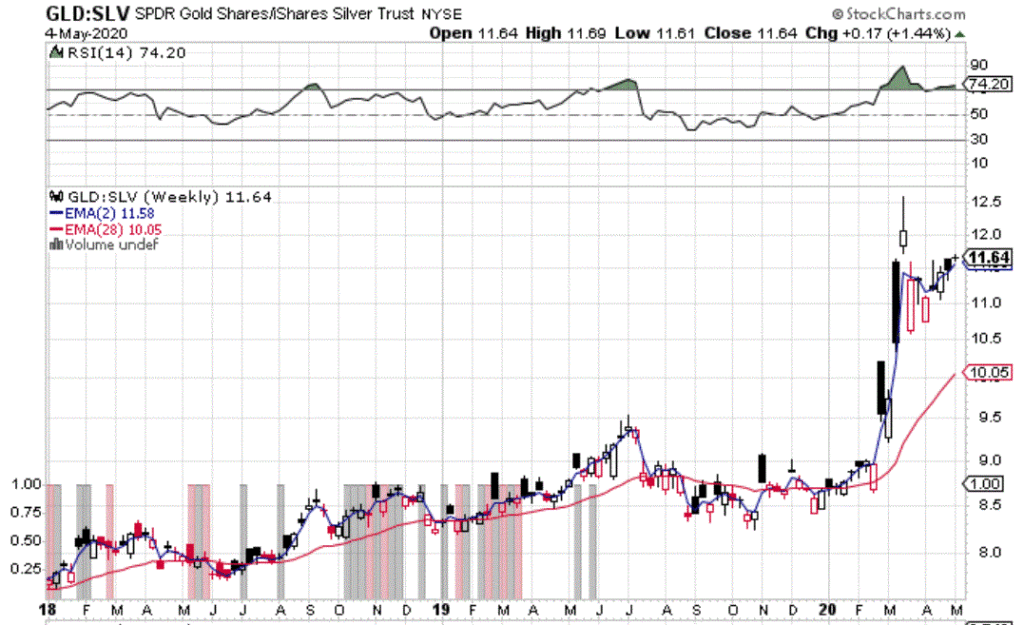
*A simple approach for many investors would be to look at ticker “GLD:SLV” at www.StockCharts.com. This divides the weekly closing price for ticker GLD (a gold bullion ETF) by ticker SLV (a silver bullion ETF).
*You can add 2-week and 28-week exponential moving averages to a weekly chart and note whether the 2-week EMA is above or below the 28-week EMA.
*It should be noted that different signals may be generated from time-to-time compared to GC-SPOTV and SI-SPOTV (which use spot closing prices for actual gold and silver).
Figure 5 displays the latest GLD:SLV chart.

Figure 5 – GLD:SLV with 2-week and 28-week EMA’s (Courtesy: www.StockCharts.com)
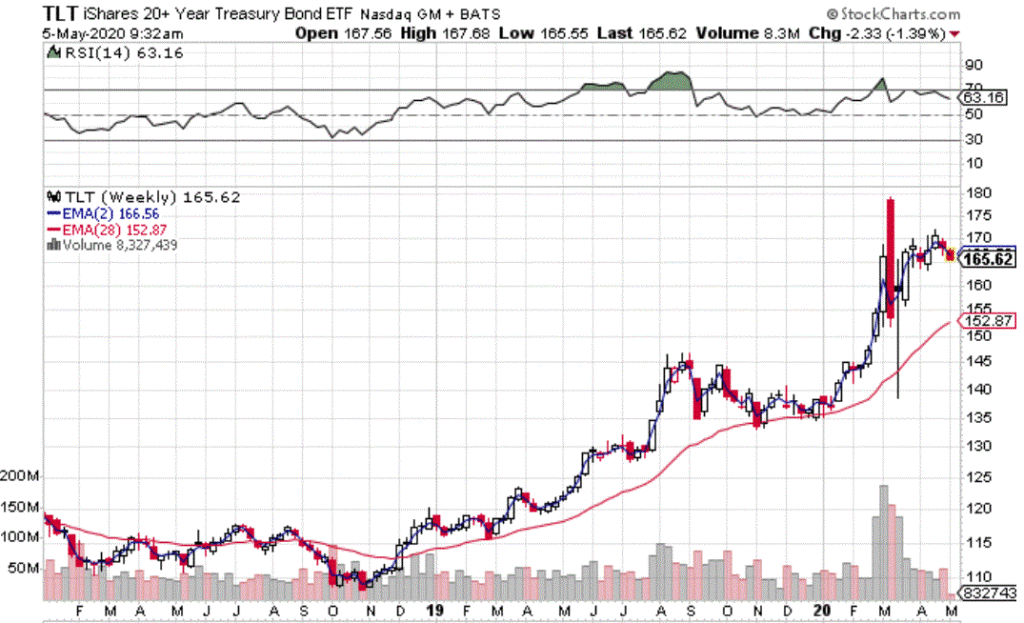
In Figure 6 you can see the relatively high degree of correlation between the long-term treasury (using ticker TLT as a proxy) versus the chart displayed in Figure 5.

Figure 6 – Long-term treasury ETF ticker TLT (Courtesy: www.StockCharts.com)
Jay Kaeppel
Disclaimer: The information, opinions and ideas expressed herein are for informational and educational purposes only and are based on research conducted and presented solely by the author. The information presented represents the views of the author only and does not constitute a complete description of any investment service. In addition, nothing presented herein should be construed as investment advice, as an advertisement or offering of investment advisory services, or as an offer to sell or a solicitation to buy any security. The data presented herein were obtained from various third-party sources. While the data is believed to be reliable, no representation is made as to, and no responsibility, warranty or liability is accepted for the accuracy or completeness of such information. International investments are subject to additional risks such as currency fluctuations, political instability and the potential for illiquid markets. Past performance is no guarantee of future results. There is risk of loss in all trading. Back tested performance does not represent actual performance and should not be interpreted as an indication of such performance. Also, back tested performance results have certain inherent limitations and differs from actual performance because it is achieved with the benefit of hindsight.


You should also have a benchmark of just long bond and see how that compares with employing the ratio as timing.
How good/bad does it look before 77 – ie early seventies?
Carl, that is an excellent question… unfortunately this is all the data I have, so I cannot offer a definitive answer. Jay