Generally speaking, when it comes to investment portfolios, the 3 key questions are:
*How much does it make?
*How much does it normally fluctuate along the way?
*How bad does it get hit when things go wrong?
The first question is important because of the obvious fact that people want to make money. The other two matter a lot because different people have different levels of risk tolerance. If an individual invests in a manner that is “too volatile” for their own risk tolerance there is a danger that they won’t “stick to the plan” when things get rough.
In any event, the real point for the purposes of this piece is that for the last 5 to 10 years the only question that most people focused on was “how much does it make?” Because there really wasn’t a whole lot of volatility – particularly downside volatility to deal with. Sure, there were downdrafts (2012, 2015, 2018), but for the most part they were very short-lived. So, by the time an investor realized that maybe they should be worried, the market had already turned back to the upside.
Ah, for the “good old days”.
In 2020 investors were abruptly reminded that – uh, paraphrasing here – “stuff happens”, and that being prepared to deal with downside volatility is still very much a part of the equation. So, this piece will look at one “portfolio approach”, and then attempt to “dial it up” just a bit.
The “Permanent Portfolio”
The impetus for this piece comes from this article on www.SeekingAlpha.com from an author who goes by “Greybeard Retirement.” His piece grew from work originally done by Harry Browne in the 1980’s. The portfolio consists of:
*25% stocks
*25% long-term U.S. bonds
*25% money market
*25% gold
The only change that I will make to this lineup is to replace money-markets with 1-3 year treasuries.
Data Used
In order to generate the longest test possible, I am using index monthly total return data rather than actual mutual fund data, as follows starting in January 1976:
Stocks: S&P 500 Index
Long-term treasuries: Bloomberg Barclays Long Treasury Index
Short-term treasuries: Bloomberg Barclays 1-3 Year Treasury Index
Gold: S&P Gold Spot Price Index
The Method
I rebalance the portfolio on January 1 each year so that each of the 4 categories starts the year as 25% of the portfolio.
Then we just hold the portfolio for the rest of the year.
The Results
Figure 1 displays the equity curve and Figure 2 the summary results.
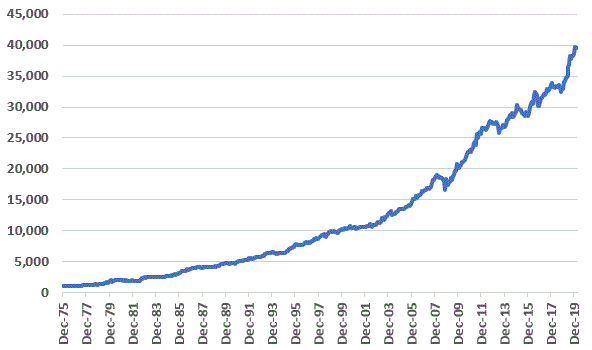
Figure 1 – Growth of $1,000 for Permanent Portfolio (1976-2020)
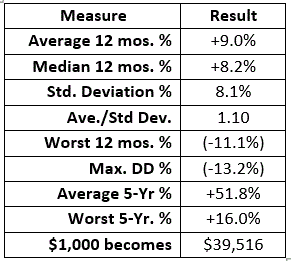
Figure 2 – Permanent Portfolio Results (1976-2020)
If you are looking for “steady growth” the results look pretty appealing. At least until you consider an alternative such as the one that gain great popularity in the last 5 years – just buying and holding an S&P 500 Index fund.
Figures 3 and 4 compare the Permanent Portfolio to buying and holding the S&P 500 Index.
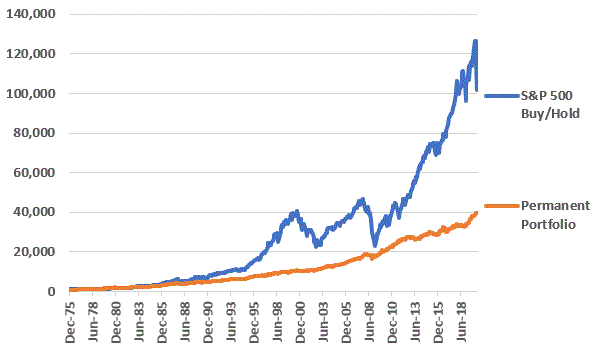
Figure 3 – Growth of $1,000 for Permanent Portfolio versus S&P 500 Buy/Hold (1976-2020)
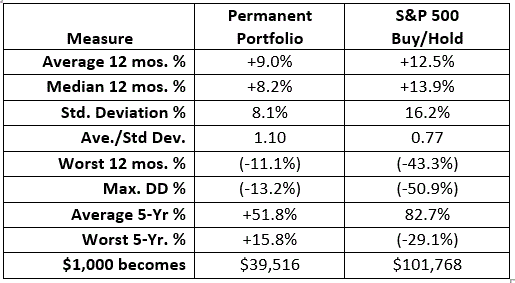
Figure 4 – Permanent Portfolio Results versus S&P 500 Buy/Hold (1976-2020)
Beauty is in the eye of the beholder, so I am not going to try to tell you what you are supposed to take away from this. I will simply point out the tradeoff:
*Buying and holding the S&P 500 Index will generally be expected to generate for gross return over time, with:
-a much higher degree of downside volatility
-a higher instance of extended periods of sideways activity (ex., 2000 to 2012 no net gain)
So is there a way to:
*Use the Permanent Portfolio
*Generate comparable gains to buying-and-holding the S&P 500 Index
*Still generate consistent, low volatility returns?
Would I as the question if the answer was “No?”
The Slightly More Aggressive Permanent Portfolio (Permanent Portfolio+)
We will refer to this approach as Permanent Portfolio+. For this test we will use the exact same data with one exception:
*For the S&P 500 Index portion of the portfolio we will use leverage of 2-to-1 (in real-world investing this would be accomplished by holding a 2x mutual fund or ETF)
Does this make a difference? You be the judge. Figures and 5 and 6 display the results for the Permanent Portfolio+ versus buying and holding the S&P 500 Index.
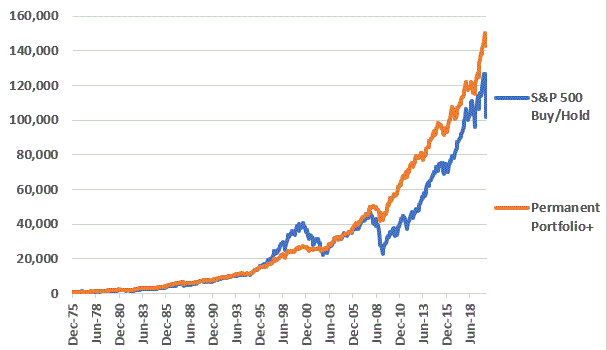
Figure 5 – Growth of $1,000 for Permanent Portfolio+ versus S&P 500 Buy/Hold (1976-2020)
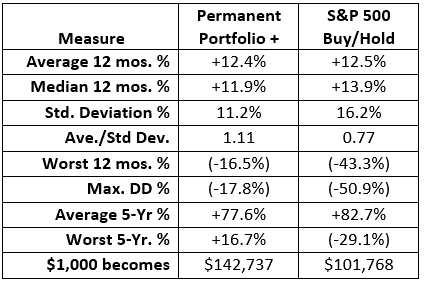
Figure 6 – Permanent Portfolio+ Results versus S&P 500 Buy/Hold (1976-2020)
The two key things to note regarding the Permanent Portfolio+ are:
*It gained 40% more than S&P Buy/Hold
*Had a standard deviation of 11.2% versus 16.2% versus S&P Buy/Hold
*Had a Worst 12 months of -16.5% versus -43.3% versus S&P Buy/Hold
*Had a Maximum Drawdown of -17.8% versus -50.9% versus S&P Buy/Hold
*Had a Worst 5-years of +16.7% versus -29.1% versus S&P Buy/Hold
Summary
So, in the Permanent Portfolio+ the “be all, end all” of investing. Probably not. For the record, it lags buying-and-holding the S&P 500 much of the time and mostly outperforms by holding up well during bear markets.
Of course, that’s kind of the point, isn’t it?
In any event, as always I am not “recommending” that anyone adopt this as their approach to investing. But it is food for thought. As a potentially lower volatility alternative to just buying and holding the stock market, the Permanent Portfolio and the Permanent Portfolio+ seems to show some promise.
Jay Kaeppel
Disclaimer: The information, opinions and ideas expressed herein are for informational and educational purposes only and are based on research conducted and presented solely by the author. The information presented does not represent the views of the author only and does not constitute a complete description of any investment service. In addition, nothing presented herein should be construed as investment advice, as an advertisement or offering of investment advisory services, or as an offer to sell or a solicitation to buy any security. The data presented herein were obtained from various third-party sources. While the data is believed to be reliable, no representation is made as to, and no responsibility, warranty or liability is accepted for the accuracy or completeness of such information. International investments are subject to additional risks such as currency fluctuations, political instability and the potential for illiquid markets. Past performance is no guarantee of future results. There is risk of loss in all trading. Back tested performance does not represent actual performance and should not be interpreted as an indication of such performance. Also, back tested performance results have certain inherent limitations and differs from actual performance because it is achieved with the benefit of hindsight.


It’s apparent Greybeard didn’t get grey whiskers from expounding wisdom.
Thank you for the time spent on this Data. . . . Doug in Texas.