Before proceeding, lets quickly review the title of this piece and its implications. First off, please note that it is NOT titled “A Solid Long-Term Low Risk-Investing Plan for Semis”. Which is good, because there really isn’t any of that in what follows. What in fact follows is a discussion of an extremely speculative approach to trading.
Are we clear? Great, let’s proceed.
The Keys to Successful Speculation
The first key to successful speculation is money management. In as few words as possible the phrase to remember is “bet small.’
Too often an individual gets bit by the “I want to make a lot of money, so I guess I’ll risk a lot of money in order to make a lot of money” bug. And that is the downfall. So remember, bet small. Risking a little to make a lot is better than risking a lot to make a lot.
The next two things are:
*Spotting opportunity
*Finding a trade to take advantage of the opportunity
Spotting opportunity can come from anywhere, but generally speaking you want the odds to be in your favor as much as possible.
Finding a trade – for most traders – involves buying shares of a stock or ETF. In this article we will use options as an alternative.
Ticker AMD
For this piece we will focus on ticker AMD. As always, the example trades highlighted on JOTM are just that, examples. I am not making any “predictions” nor “recommendations”. In fact, AMD is a tad “overbought” (if one looks at the 3-day RSI for AMD), so in a perfect world I might even consider waiting for at least a slight pullback before acting on the example idea below. But I am getting ahead of myself.
For the record, I am not a huge Elliott Wave guy, however, I do pay attention on those occasions when the daily AND weekly wave counts align to either the bullish or bearish side.
For Elliott Wave counts I rely on ProfitSource by HUBB. The reality is that it is hard to get two “Elliott Heads” to agree on the correct current wave count for much of anything, and I personally have no ability whatsoever to “count waves” in any objective or useful manner. Which is why I like the fact that ProfitSource – for better or worst – has an objective built in algorithm for doing so.
Figure 1 displays the daily Elliott Wave count for ticker AMD, which is projecting a Wave 5 advance to the $64-$71 a share range sometime between late April and late May. Sounds optimistic to me, but there you have it.
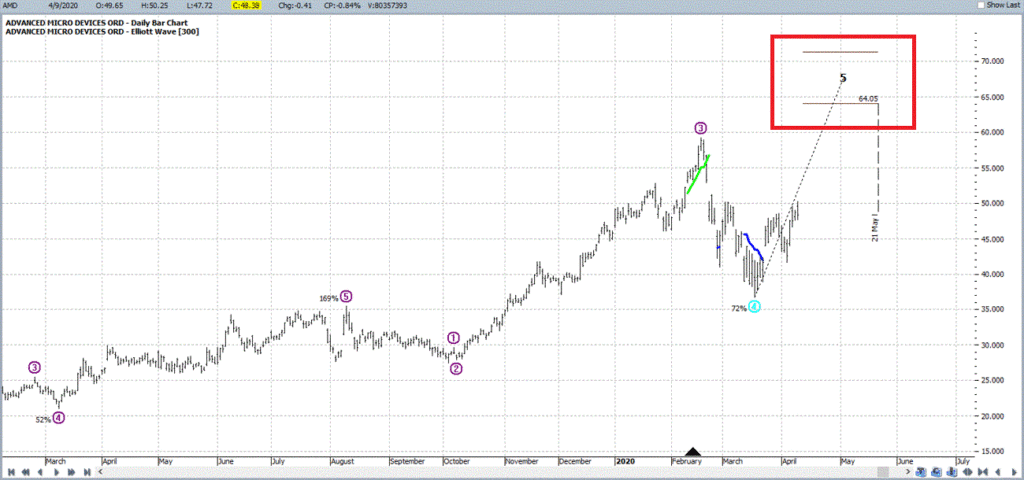
Figure 1 – AMD daily with Bullish Wave 4 buy (Courtesy ProfitSource by HUBB)
Figure 2 displays the weekly Elliott Wave count for ticker AMD, which is projecting a Wave 5 advance to the $66-$78 a share range sometime between mid-October and July 2021.
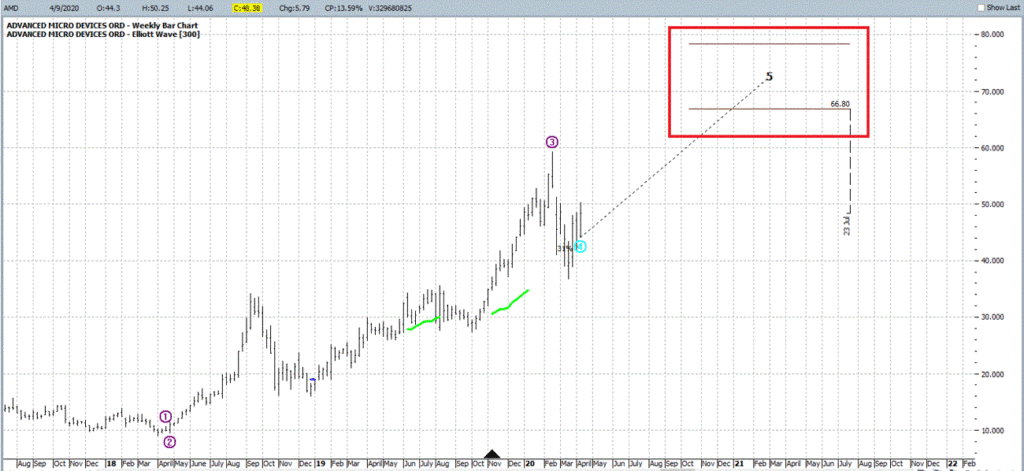
Figure 2 – AMD weekly with Bullish Wave 4 buy (Courtesy ProfitSource by HUBB)
Will either of these counts prove prescient? It beats me. What does get my attention is that both the daily and weekly are projecting Wave 5 advances at the same time.
As I mentioned earlier, one of the keys is putting the odds on your side. So, let’s look at a few more potential “pieces of the puzzle.”
Figure 3 displays the annual seasonal trend for ticker SMH – which is an ETF that tracks the semiconductor industry. Note that we are now past the typical period of weakness and that the seasonal trend going forward is positive. At the very least, we are not sailing into any seasonal headwinds.
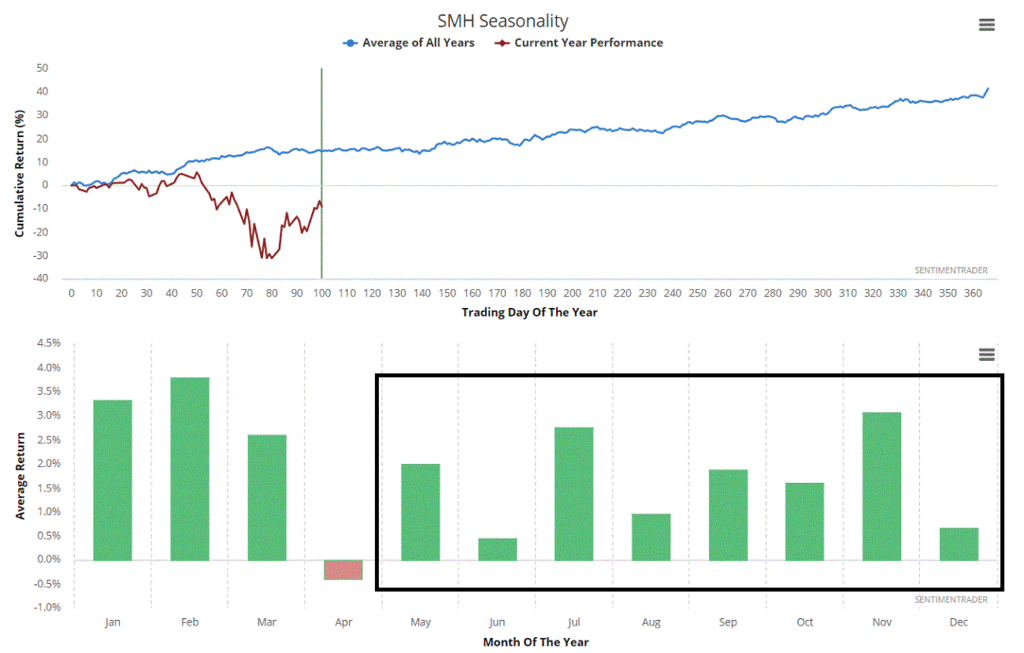
Figure 3 – Semiconductor seasonality (Courtesy Sentimentrader.com)
Figure 4 displays trader sentiment towards the semiconductor industry. Note that this is generally a contrary indicator – i.e., low readings suggest bearish sentiment is overdone and high readings suggest bullish sentiment is overdone. Note that sentiment WAS overly bullish buy is now neutral. While this is not necessarily a positive, the point is that at the moment it is NOT a negative working against semiconductor stocks.
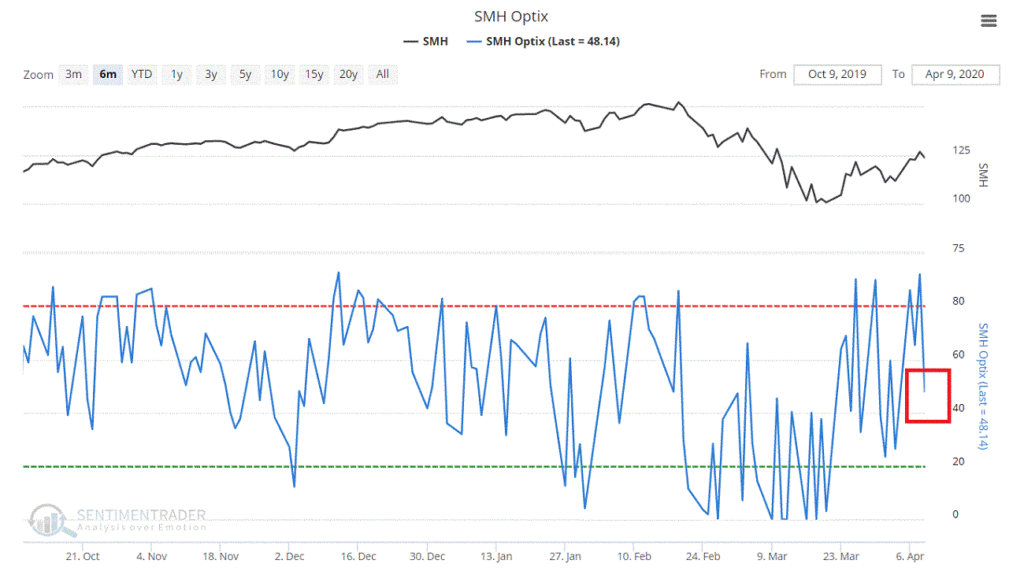
Figure 4 – SMH sentiment (Courtesy Sentimentrader.com)
Figure 5 displays the price chart for AMD with the 90-day option implied volatility (black line). Note that after the big “spike”, IV has now declined back down to the normal range. In other words, while AMD options may not necessarily be “cheap”, they also are NOT “expensive.”
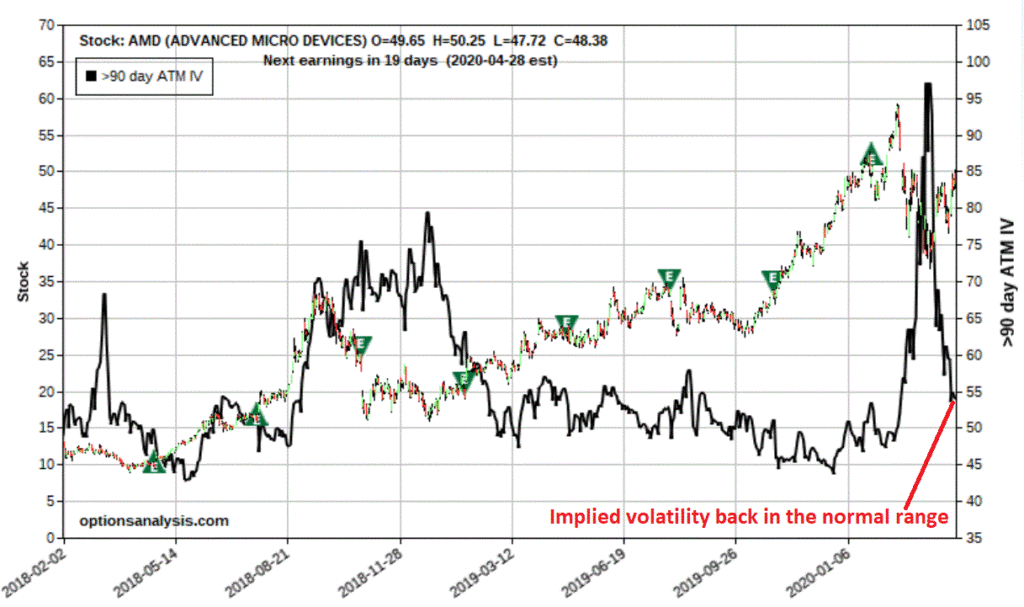
Figure 5 – AMD option implied volatility (Courtesy www.OptionsAnalysis.com)
One Way to Play
If one is bullish on AMD the most straightforward play is simply to buy shares of AMD. For sake of example, we will make the following assumptions:
*The daily wave count will prove accurate and AMD will rally towards 64 sometime in the next several months (this is NOT a prediction I am making, just an example assumption that a trader must either make – or not make, when deciding, a) whether or not to trade in the first place, and if so, b) which trade to make
*We are willing to risk a maximum of 3% of our capital. For sake of example we will assume of $25K trading account, so 25K x 3% = $750 maximum risk we will take
Given all of the this a trader might consider buying 2 July2020 52.5 AMD calls at $3.75 as shown in Figures 6 and 7

Figure 6 – AMD July 52.5 calls (Courtesy www.OptionsAnalysis.com)
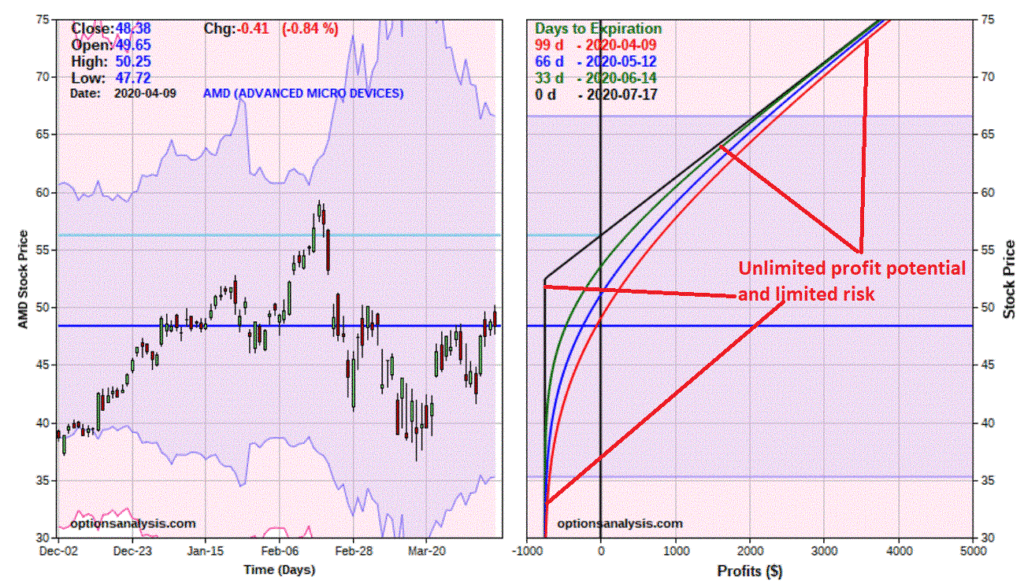
Figure 7 – AMD calls risk curves (Courtesy www.OptionsAnalysis.com)
Things to Note:
*Maximum risk if held until expiration is $750
*Breakeven price is $56.25
The good news is that this trade gives us unlimited upside potential for a cost of $750 for a 2-lot. The bad news is that with the stock presently trading at $48.38, the stock MUST advance 16% in price between now and mid-July in order to even breakeven.
Hence the use of the word “speculation.” In other words, AMD MUST rally sharply in the next 3+ months or this trade will lose money.
Remember though that the catalyst for the trade is the belief that the Elliott Wave count will prove accurate and that AMD will in fact rally strongly. If you don’t believe that then there is no reason to make this trade in the first place.
A Closer Look
*The daily EW count suggested that AMD would reach $64.05.
*We also know that the recent low is AMD was $36.75.
*So, let’s zoom in and take a closer look at “where this trade lives” – which is between $36.75 and $64.05 between now and 6/22 (which is 25 days prior to option expiration – most time decay would occur between that day and July expiration).
*Figure 8 displays the risk curves for this trade as of 6/22, which is 25 days prior to option expiration (and before most of the time decay will occur as the option gets closer to expiration).
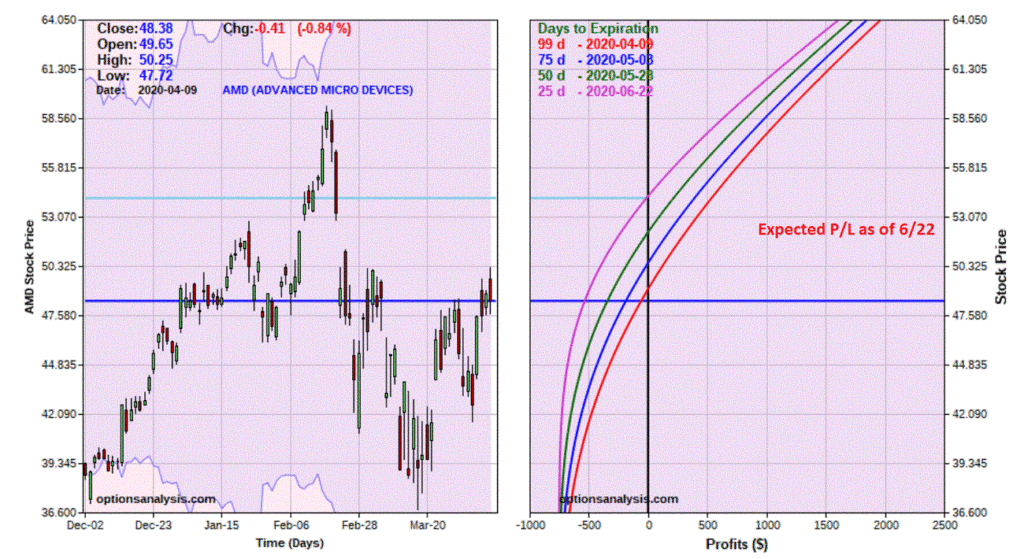
Figure 8 – AMD call risk curves as of 25 prior to option expiration (Courtesy www.OptionsAnalysis.com)
*If AMD DOES reach $64.05 a share this trade will show an open profit of roughly $1600 to $1950, depending on whether that price level is reach later or sooner.
*If AMD is below $54.32 on June 22nd chances are this trade will be showing a loss
*If AMD sinks in price, this trade will absolutely, positively lose most of its value.
The bottom line: If you are not willing to bet on a sharp advance in AMD shares in the next several months, and/or if you are unwilling or unable to risk $750, then this trade is to be avoided.
Summary
Is making a bullish bet on AMD a good idea? I am not saying that it is or is not. Please remember, this is NOT a “recommendation.” I am merely highlighting several factors that a trader “might” consider to be favorable signs (bullish daily and weekly EW counts, positive seasonality, no negative sentiment headwind, option volatility back in a normal range (i.e., option premiums are not “expensive”, etc.).
Does any of this mean that the example trade will end up profitable? Not at all. Hence the reason:
a) only 3% of total capital is committed to the trade, and
b) it is clearly labeled as “speculation.”
One last note: A trader might also consider buying a longer-term option to give AMD more time to “move.” The upside is that you may have more time for AMD to stage an advance. The potential negatives are:
a) longer-term options are more expensive that shorter-term options,
b) bid/ask spreads tend to be wider,
c) longer-term options are affected more by changes in implied volatility (if AMD does rally, chances are IV will decline more, thus a longer-term option may lose more time premium due solely to a change in IV than a shorter-term option)
A lot to chew on for a silly little speculative trade, no? But remember, if you want to succeed in speculating in the long run, remember these words:
“Nothing worth doing is ever easy”
(Sorry, but I don’t make the rules…)
Jay Kaeppel
Disclaimer: The information, opinions and ideas expressed herein are for informational and educational purposes only and are based on research conducted and presented solely by the author. The information presented does not represent the views of the author only and does not constitute a complete description of any investment service. In addition, nothing presented herein should be construed as investment advice, as an advertisement or offering of investment advisory services, or as an offer to sell or a solicitation to buy any security. The data presented herein were obtained from various third-party sources. While the data is believed to be reliable, no representation is made as to, and no responsibility, warranty or liability is accepted for the accuracy or completeness of such information. International investments are subject to additional risks such as currency fluctuations, political instability and the potential for illiquid markets. Past performance is no guarantee of future results. There is risk of loss in all trading. Back tested performance does not represent actual performance and should not be interpreted as an indication of such performance. Also, back tested performance results have certain inherent limitations and differs from actual performance because it is achieved with the benefit of hindsight.

