In this article I highlighted the fact that a big number of new highs OR new lows can be bullish for the stock market. As it turns out, a big price movement – either up or down – can also have the same effect.
The kernel of knowledge for today comes from the work of Wayne Whaley, who last I knew worked at Witter & Lester. The truth is I kind of lost touch with Wayne in recent years, but the relevant fact is that he does a lot of very unique market analysis. Like this for instance:
*A = 5 day % change in price for the S&P 500 Index
*If A is >= +10.00% OR A is <= -13.85% it appears to be bullish for the stock market
To quantify a little bit let’s add the following rules:
*If A is >= +10.00% OR A is <= -13.85% then hold the S&P 500 Index for 252 trading days (ostensibly 1-year)
*If a buy signal is already in force and another signal occurs then extend the holding period for another 252 trading days
For lack of a better name we will refer to this “indicator” as WW (in Wayne’s honor). Figure 1 displays the 5-day% change in price for the S&P 500 Index starting in 1970.

Figure 1 – S&P 500 Index 5-day % price rate-of-change (1970-2020)
Figure 2 displays the Buy and Sell dates using the rules above.

Figure 2 – Buy and Sell Dates for WW; 1970-2020
A few things to note:
*The median gain 12-months later was +26.0%
*The median maximum drawdown from the entry date was -7.7%
*There aren’t many occurrences so it is more of an anecdotal piece of information than the crux of a system or strategy
*However, what is interesting to note is that signals tend to occur at very significant points in time for the market:
-The end of the 1970 bear market
-The end of the 1974 bear market
-The early stage of the 1982 bull market
-The day of the 1987 Crash
-The late stages of the 2000-2002 bear market
-During the 2008 bear market (this signal was a bit early as the market declined another -32% before bottoming)
-During the late stages of the March 2020 panic
Overall, these marked some of the most important buying opportunities in the last 50 years.
Figure 3 displays the cumulative % growth for the S&P 500 Index if bought and held ONLY during the dates displayed in Figure 2.

Figure 3 – Cumulative price change for S&P 500 Index during bullish periods as signaled by WW (1970-2020)
Figures 4 through 10 display the periods shown in Figure 2
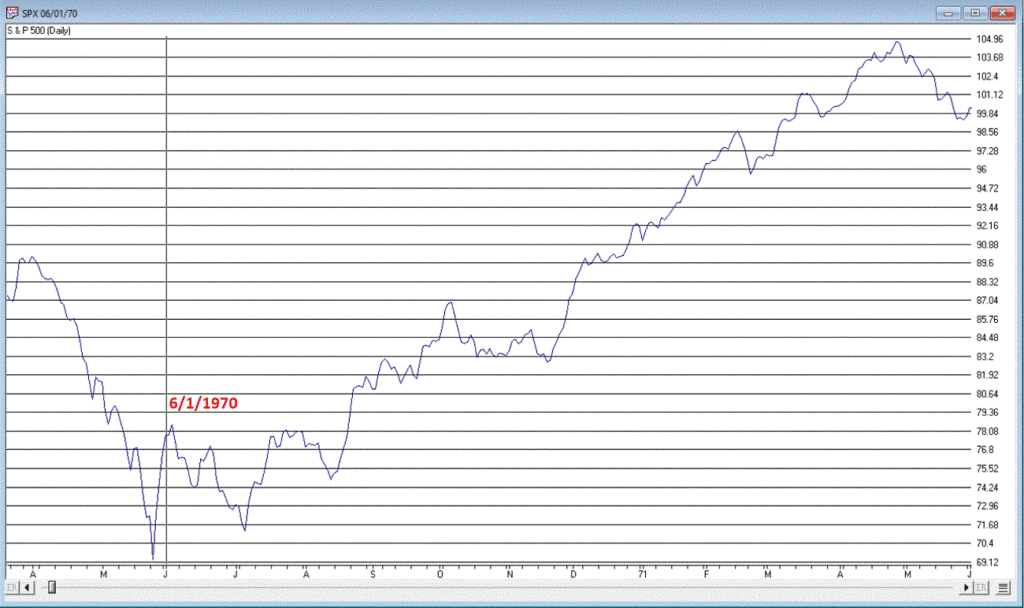
Figure 4 – 1970 Signal (Courtesy AIQ TradingExpert)
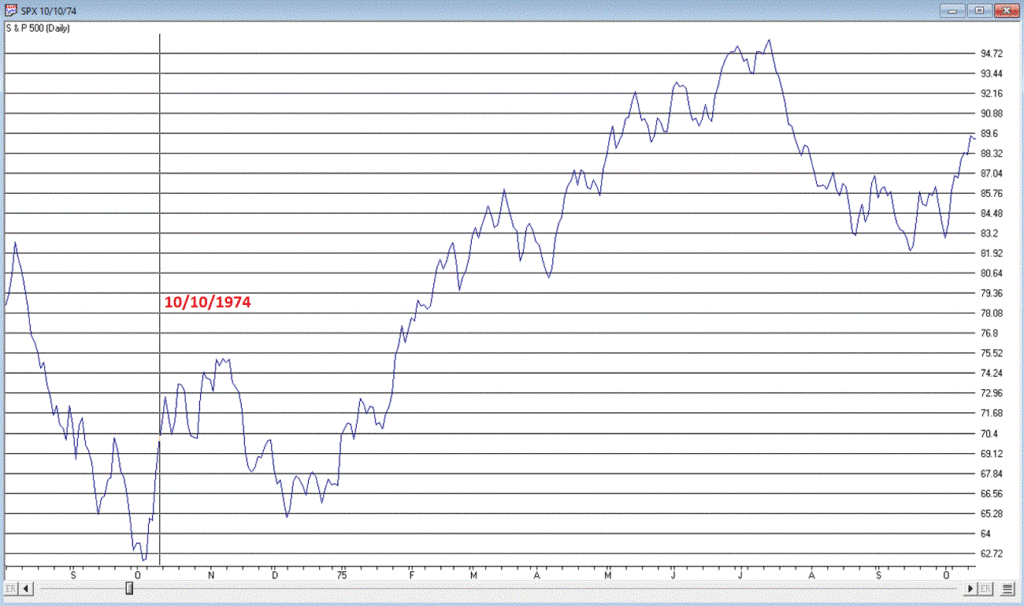
Figure 5 – 1974 Signal (Courtesy AIQ TradingExpert)
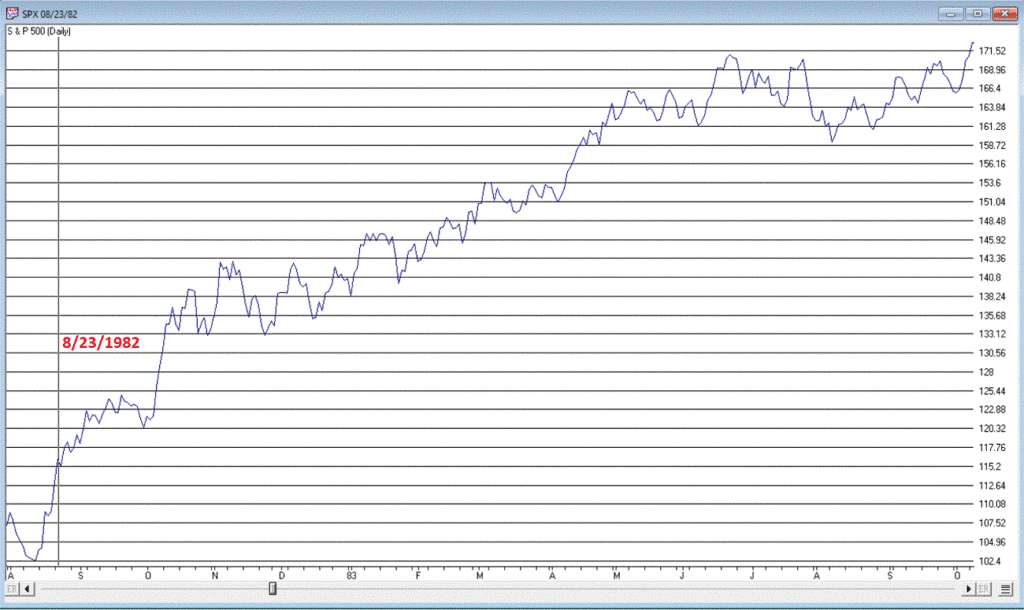
Figure 6 – 1982 Signal (Courtesy AIQ TradingExpert)
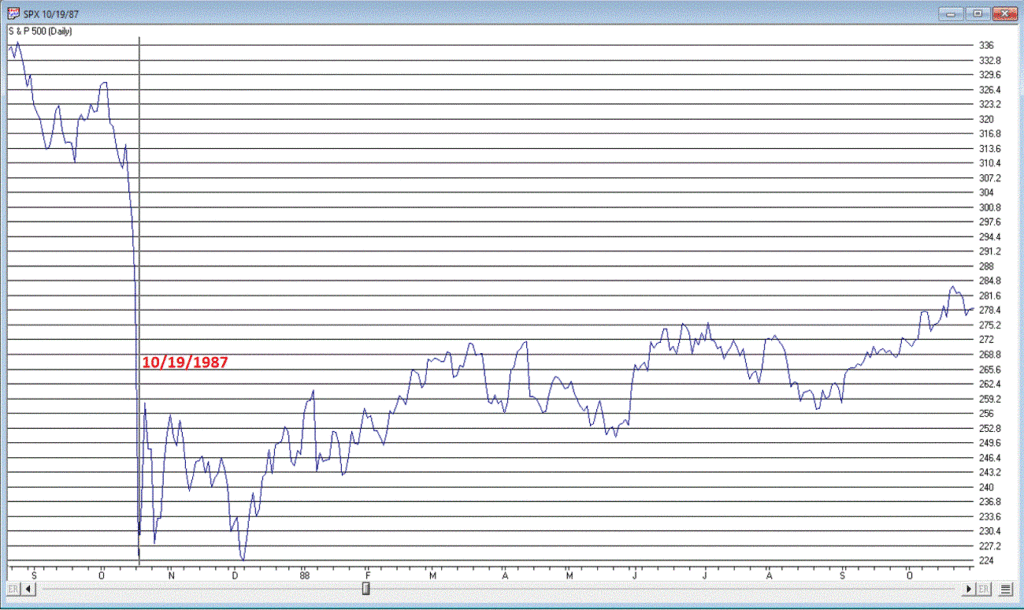
Figure 7 – 1987 Signal (Courtesy AIQ TradingExpert)
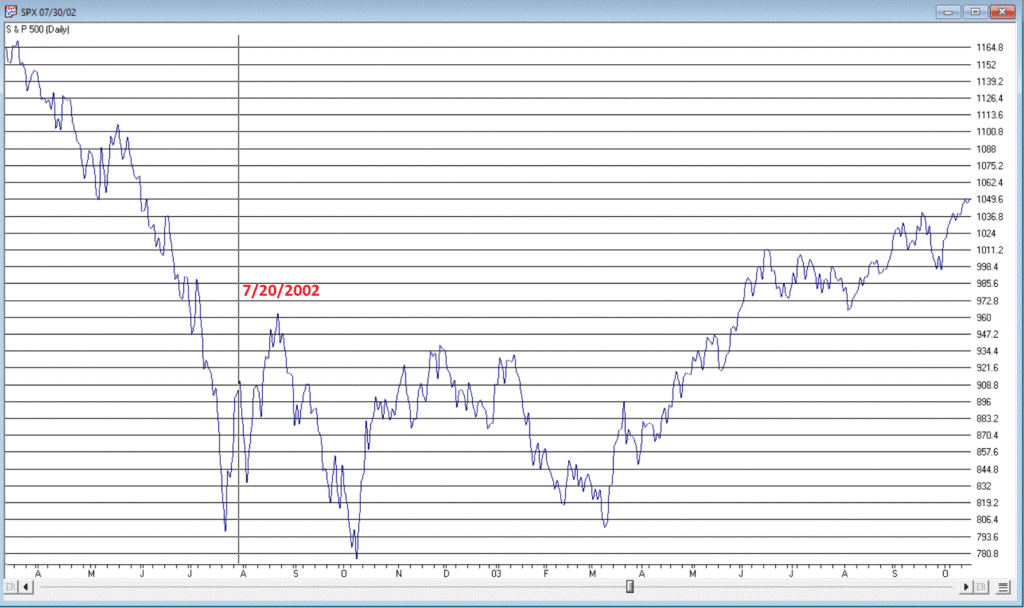
Figure 8 – 2002 Signal (Courtesy AIQ TradingExpert)
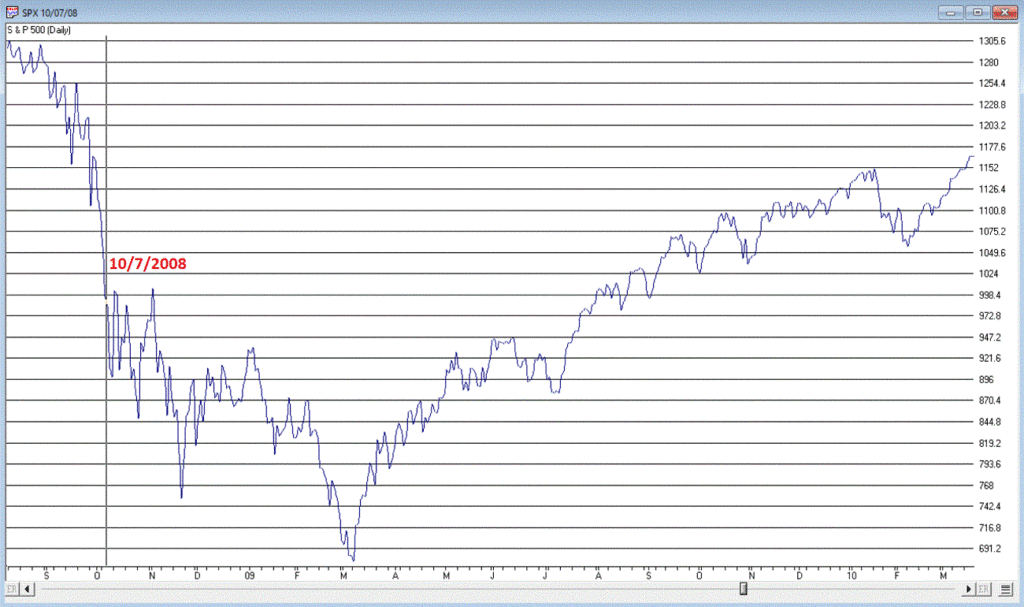
Figure 9 – 2008 Signal (Courtesy AIQ TradingExpert)
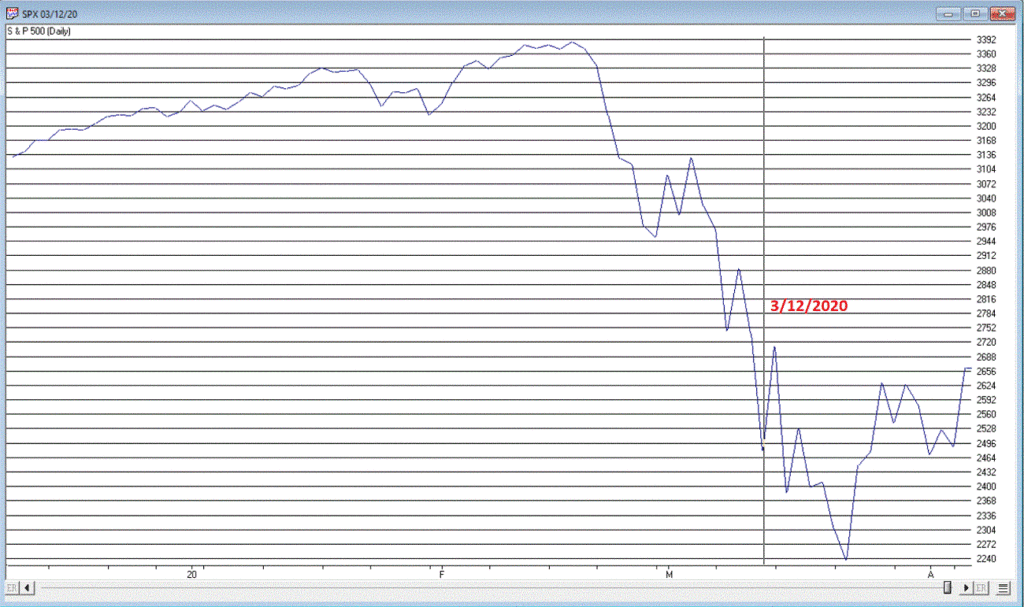
Figure 10 – 2020 Signal (Courtesy AIQ TradingExpert)
Summary
One cannot discount the potential for more downside in the market. Remember that following the October 2008 WW signal the market worked its way 32% lower over the next 4.5 months.
Still, if history is an accurate guide, we may look back on March 2020 as an opportunity on a par with 1970, 1974, 1982, 1987, 2002 and 2008.
Here’s hoping.
Jay Kaeppel
Disclaimer: The information, opinions and ideas expressed herein are for informational and educational purposes only and are based on research conducted and presented solely by the author. The information presented does not represent the views of the author only and does not constitute a complete description of any investment service. In addition, nothing presented herein should be construed as investment advice, as an advertisement or offering of investment advisory services, or as an offer to sell or a solicitation to buy any security. The data presented herein were obtained from various third-party sources. While the data is believed to be reliable, no representation is made as to, and no responsibility, warranty or liability is accepted for the accuracy or completeness of such information. International investments are subject to additional risks such as currency fluctuations, political instability and the potential for illiquid markets. Past performance is no guarantee of future results. There is risk of loss in all trading. Back tested performance does not represent actual performance and should not be interpreted as an indication of such performance. Also, back tested performance results have certain inherent limitations and differs from actual performance because it is achieved with the benefit of hindsight.

