History suggests (see data below) that now is the time to be looking to increase exposure in the mid-cap space. Ironically, now is the time when investors are most likely to look away. Same as it ever was when it comes to investor psychology.
In the 1st quarter of 2020, the S&P 400 Midcap Index suffered its worst quarterly loss since it was first created in 1981. While this was a painful gut punch and may naturally cause reactive investors to turn away from mid-caps, if history is a guide mid-caps may be setting up to perform exceptionally well on a relative and absolute basis in the short-term as well as over the next 5 years.
Chances are good we will look back at the current period as a good time to increase exposure to the Mid-cap sector. Consider the following…
The Historical Record
The S&P 400 Midcap Index has been a stellar performer over time, handily outpacing large-cap and small-cap stocks. Figure 1 displays a logarithmic chart displaying the growth of $1 invested since January 1981 on a buy-and-hold basis for:
*Mid-Caps – S&P 400 Index (blue): +9,246%
*Large-Caps – S&P 400 Index (orange): +5,171%
*Small-Caps: Russell 2000 (grey): +2,853%
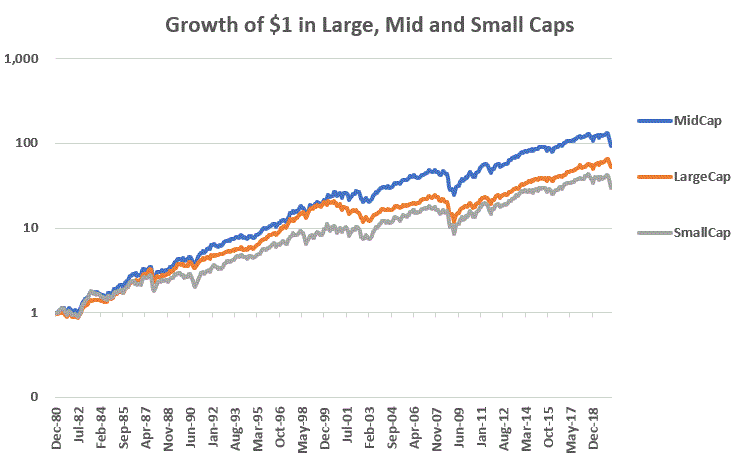
Figure 1 – Mid-cap, Large-cap and Small-cap; Growth of $1, 1981-2020
As you can see, since the S&P 400 Midcap Index was created in 1981, mid-caps have outperformed large-caps by a factor of 1.79-to-1 and small-caps by a factor of 3.24-to-1.
Surprisingly, very few investors are aware of this.
Most investors tend to be lured to the “growth potential” of small-caps and/or the “steady nature” of “established” large-caps (i.e., this is often code for “companies whose name I recognize”). But the long-term record clearly points to the fact that the mid-cap space is “where the growth is.”
The simplest explanation backing this theory states that “mid-caps are former small cap on their way to becoming large caps”, i.e., it’s where the growth is.
What the Historical Record Says About Potential Future Performance
While the performance of mid-caps has been abysmal in early 2020, history suggests that this dismal performance may be setting the stage for a significant bounce back. To wit:
Figure 2 displays S&P 400 performance 1 to 5 years after the worst quarterly performances for the index since it was first calculated in 1981.
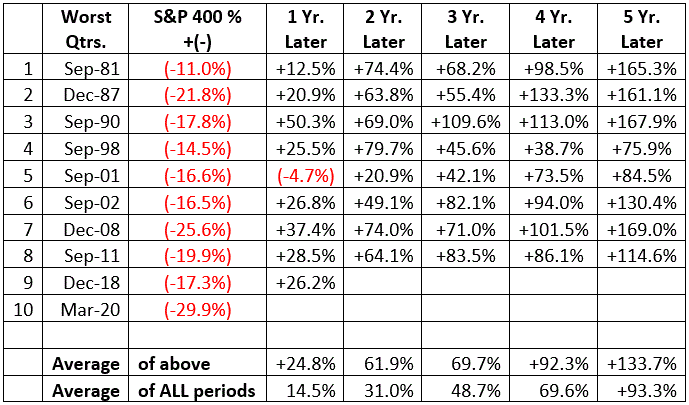
Figure 2 – Worst Quarters for S&P 400 MidCap Index and subsequent forward performance
Note that the average 1, 2, 3, 4 and 5 year forward performance handily outperformed the average performance for ALL 1, 2, 3, 4- and 5-year periods.
Regarding the next 12 months, Figure 3 displays the cumulative growth for the S&P 400 Index during the 12 months following each of the dates listed in Figure 2.
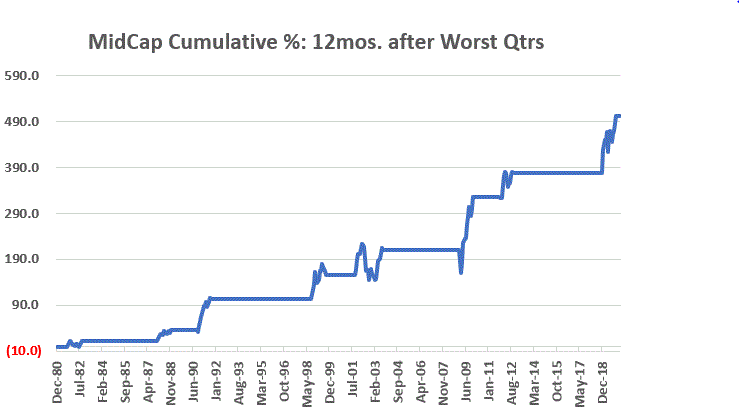
Figure 3 – Cumulative performance Mid-caps held ONLY during the 12-months following each of the worst quarters for S&P 400 Index listed in Figure 2
Mid-Caps vs. Large-Caps after Mid-Caps experience exceptionally bad quarter
The tables below display the returns for mid-caps AND large-caps over 1 to 5-year periods directly AFTER Mid-Caps experience a quarterly decline of -11% or more, and the difference in performance between the two.
NOTE: Except for the 1-year performance after the Dec-2018 signal, Mid-Caps have outperformed Large-Caps over every time frame with rare exceptions.
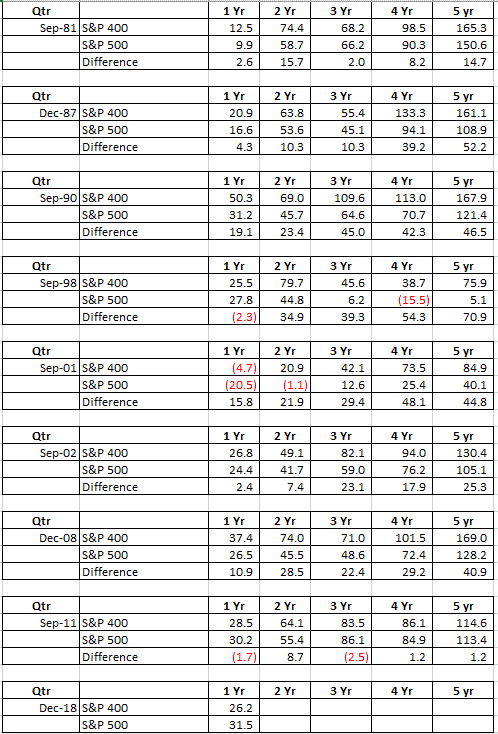
Figure 4 – Mid-Caps invariably outperform S&P 500 after experiencing a large quarterly loss
Summary
Emotion has a strong impact on investors. When a security suffers a large loss, human nature tends to make investors believe that that security should be avoided. But quite often this is exactly the time that investors should be flocking to a given security as the back-and-forth nature of markets sets the stage for a strong rebound.
Large-cap stocks have been the “go to” segment during much of the recent bull market and in the early stages of the current decline. History strongly suggests that this trend will not last forever, and that a powerful reversion to the mean will soon favor the mid-cap space once again.

