Monthly Archives: March 2020

“Airline Collapse”: The AAL Edition

Here, here and here I have highlighted situations where exorbitantly high implied volatility levels have created opportunities to sell very far out-of-the-money cash secured put options.  So far, I have highlighted examples in the cruise line and hotel/gaming industry, specifically:

RCL – Royal Caribbean

CCL – Carnival Cruise Lines

MGM – MGM Resorts International

This time out we turn our attention to the very troubled airline industry.  With individuals everywhere cancelling travel plan left and right, the airlines are in a world of hurt right now – and figure to be for some time into the foreseeable future. 

As with the previous examples, the goal here is NOT to “pick a bottom”, or even necessarily to buy shares of stock – although that could happen.  However, if these trades do end up with a stock position being held it will be at what would seem to be rock bottom prices. 

The fear associated with “current events” has pushed the implied volatility for options on many stocks to staggeringly high levels.  This creates the potential – and please make careful note of the word “potential” – to sell out-of-the-money put options as a way to, a) generate income, and/or b) buy stock at well below current levels.

IMPORTANT NOTES (repeated from the previous article): 

*I am not recommending that anyone pursue the strategy I am highlighting (it’s known as a cash secured put) – it is presented merely as “one way to play” in an extremely volatile market clouded in nearly unprecedented uncertainty.  Every trader has to learn the pro’s and con’s and decide for themselves.

*The purpose of the strategy in these articles is to sell far out-of-the-money options when implied volatility – and thus time premiums – are exorbitantly high, and to hopefully buy then back when IV abates.  However, being required to buy the shares if necessary is part of the deal.

*That being said, the goal of the strategy discussed in these articles is not really to “accumulate shares of stock at below current price levels” (although that is one common use for this strategy), rather the belief (hope?) is that someday the cloud of panic will abate – if only temporarily – and that implied volatility levels will plummet from their current stratospheric heights, and many put options will collapse in price as time premium evaporates (due solely to the decline in IV).  At that point – ideally – the options can be bought back at a profit rather than being held until expiration.

*My opinion is that this strategy should ONLY be used in a “cash secured” manner, i.e., you need to have enough cash in your account to buy the underlying stock at the strike price if necessary.  DO NOT sell naked puts in this market on margin (again, just my opinion) – the risk in this environment is simply too great.

*If you are not willing to buy the underlying stock at the strike price – again, in my opinion – DO NOT sell cash secured puts.  Why?  Because if the price of the stock does decline you either typically have to ultimately buy the stock or buy back the put – most likely at a loss. 

Now on to today’s idea.

Ticker AAL

Like the cruise line and hotel and gaming industry, the airline industry is getting crushed by the impact of the coronavirus.  Nobody knows what the full impact will be and the reality is that things are likely to get worse before they get better.  But as I have said in the past, opportunity is where you find it.

Figure 1 displays the sharp decline in AAL (American Airlines) stock AND the massive spike in implied volatility.
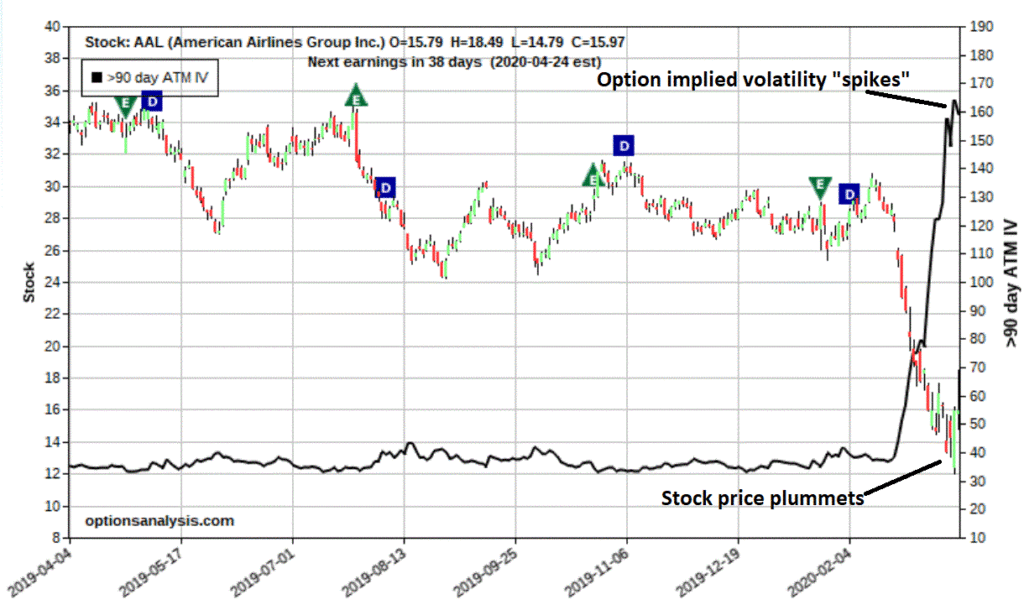
Figure 1 – AAL stock price plummets, AAL option implied volatility “spikes”

So far, AAL has tanked -61% between February 12th and the low on 3/16/20.  

IMPORTANT NOTE: Under no circumstances would I consider buying shares of AAL stock at this point in time.  This is a classic potential case of trying to “catch a falling safe”.  Trying to “pick a bottom” in this type of decline is simply foolhardy.  But that is NOT what selling a cash secured put is about.  

The example trade we will consider for AAL involves:

*Selling 10 January2021 3 puts @ $0.84

*This action takes in $840 worth of premium ($0.83 x 100 shares x 10 puts)

*The trader needs to have $3,000 in cash in the account to cover the potential purchase of the 1,000 shares of stock if need be (this can include the $840 of premium received, so the investor needs to put up another $2,160 in cash)

Figures 2 and 3 display the particulars and the risk curves for this trade.

Figure 2 – AAL secured put particulars
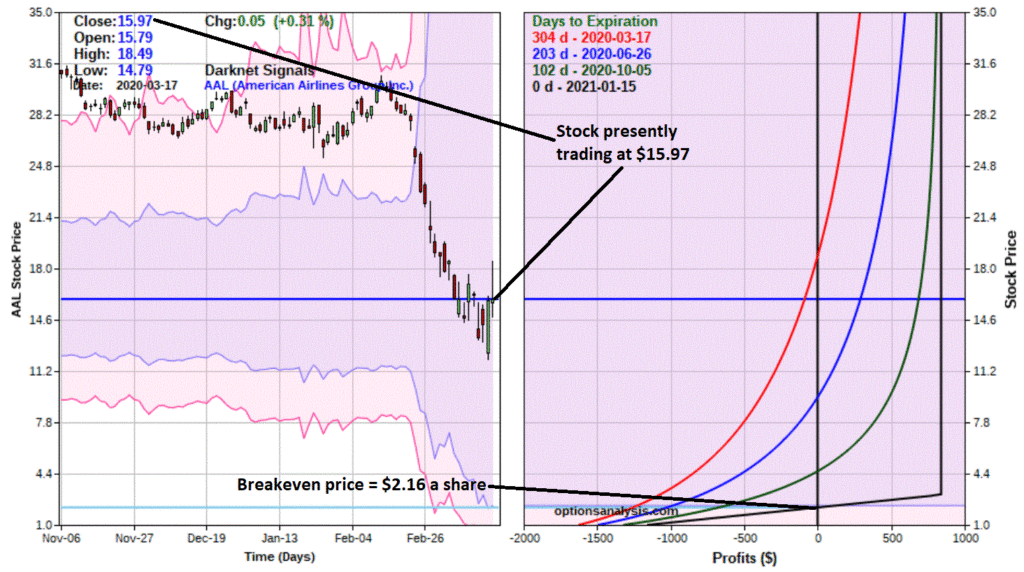
Figure 3 – AAL secured put risk curves

Note that the implied volatility for this option as this is written is a whopping 189.9%!  In the prior four years (see the most recent 12 months in Figure 1) the typical range for AAL 90-day option IV was 30%-40%.

Other things to note:

*There are 304 days left until option expiration – we are hoping for a significant decline in IV sometime between now and then

*The option is trading at $0.84 bid/$0.93 ask.  This is a wide bid/ask spread for options trading in this price range.  A trader could use a limit order and try to get filled at a price above $0.84. For sake of simplicity we are assuming a fill using a market order at the bid.

*AAL (as this is written) is trading at $15.97 a share.  The breakeven price for this position is $2.16 a share, which is -86% below the current price. 

The possible outcomes:

*If AAL completely collapses, we could end up buying 1,000 shares at $3.00 apiece.  But remember, since we took in $0.84 for each option, we sold our effective buy price is $2.16 a share ($3.00 – $0.84 = $2.16)

*Worst case scenario, AAL goes bankrupt, the shares go to $0 and we lose the full $2,160 at risk

*The most likely outcome (hopefully) is that, either:

a) in 304 days, the options expire worthless and we keep the $840 in premium.  This works out to a 38.9% return ($840 return / $2,160 cash held to secure the put options) in roughly 10 months’ time

b) Somewhere along the way implied volatility – and thus the price of the option – plummets, and we can buy back the option early and a price below $0.84 per option.

The bottom line?  If AAL does ANYTHING better than collapsing another 86% in the next 10 months this trade stands to make a decent return.

Now comes the real question: Is this actually a good idea?  As with the previous examples, that’s not for me to say.

Jay Kaeppel

Disclaimer: The information, opinions and ideas expressed herein are for informational and educational purposes only and are based on research conducted and presented solely by the author.  The information presented does not represent the views of the author only and does not constitute a complete description of any investment service.  In addition, nothing presented herein should be construed as investment advice, as an advertisement or offering of investment advisory services, or as an offer to sell or a solicitation to buy any security.  The data presented herein were obtained from various third-party sources.  While the data is believed to be reliable, no representation is made as to, and no responsibility, warranty or liability is accepted for the accuracy or completeness of such information.  International investments are subject to additional risks such as currency fluctuations, political instability and the potential for illiquid markets.  Past performance is no guarantee of future results.  There is risk of loss in all trading.  Back tested performance does not represent actual performance and should not be interpreted as an indication of such performance.  Also, back tested performance results have certain inherent limitations and differs from actual performance because it is achieved with the benefit of hindsight.
A Glimpse of Just How Oversold this Market Is

The chart in Figure 1 is not the “be all, end all” of overbought/oversold indicators.  Likewise, given the unprecedented nature of the current situation, please understand that it is NOT intended to indicate a “buy” or “all clear” signal.  It is simply intended to highlight the extremely oversold nature of the current market environment.

Please see also “Casino Collapse: The MGM Edition”

Ticker VXO

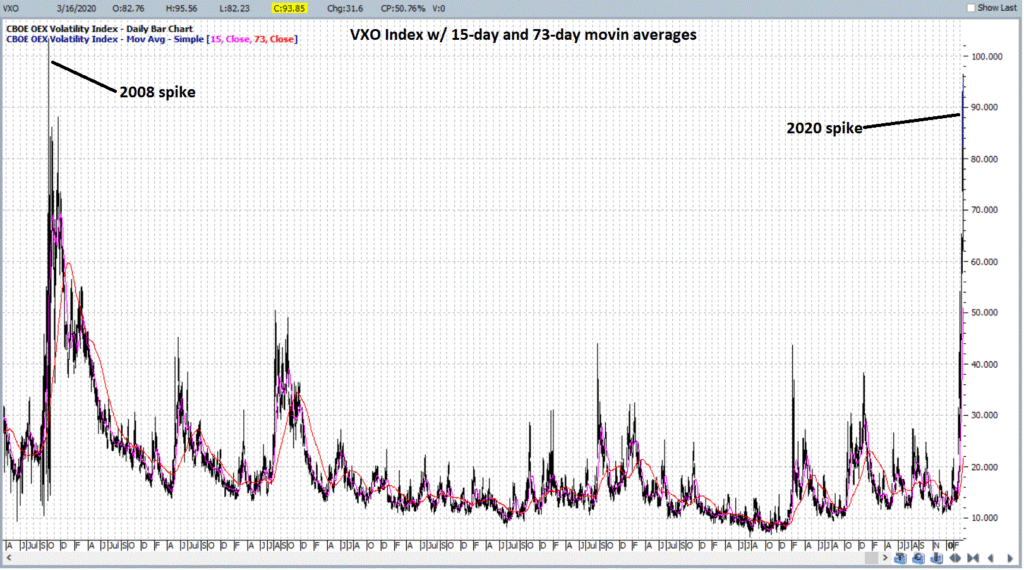
Ticker VXO is the “old” VIX Index, which measures the implied volatility of options on the S&P 100 Index (the “new” or current VIX Index uses options on the S&P 500 Index).  When fear strikes, VXO “spikes” to sharply higher levels. 

Figure 1 displays VXO with the 15-day and 73-day moving averages of daily readings.  Note that when VXO “spikes” higher, the gap between the 15-day and 73-day averages widens significantly for a period of time.  This gap often – although importantly, not always – accompanies “peak fear” for that move.

Figure 1 – VXO Index with 15-day and 73-day moving averages

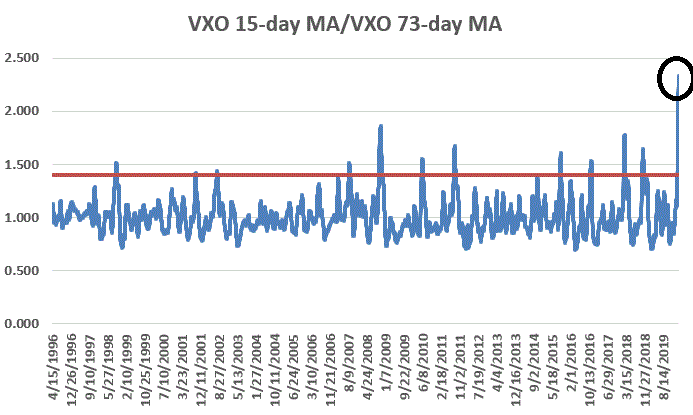
Because the 14-day average reacts more quickly than the 73-day average, one way to measure “peak fear” is by dividing the 15-day moving average by the 73-day moving average.  See Figure 2.

Figure 2 – VXO 15-day MA divided by VXO 73-day MA

*Typically a reading over above 1.40 is a sign of an extremely oversold market

*As of 3/16/20, this VXO 15/73 ratio stood at a record high 2.333

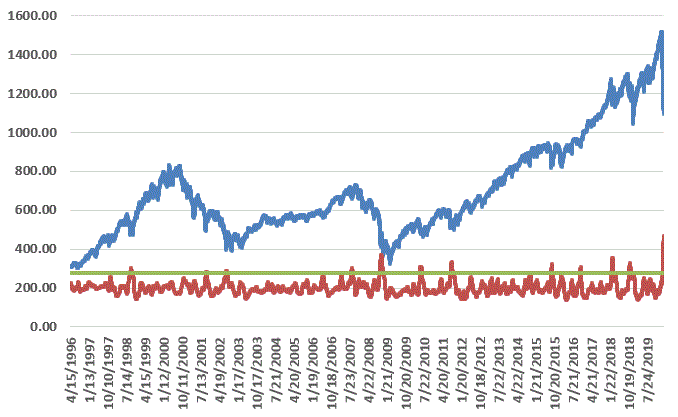
For perspective, Figure 3 displays:

*The S&P 100 Index (OEX) in blue

*The VXO 15/73 ratio (x 200 to make it more easily viewable) in red

Figure 3 – S&P 100 Index versus VXO 15/73 day MA ratio

What does it all mean?  If history is a guide, it suggests that the worst of this particular downdraft has likely already occurred.  Unfortunately, it DOES NOT mean that there cannot be further sizeable down moves nor that a massive new rally will unfold anytime soon.

What it does show is that fear is at an extremely elevated level.  Typically, this can mark an opportunity for, a) skillful traders, and b) investors with a long-term horizon.

Here’s hoping.

Jay Kaeppel

Disclaimer: The information, opinions and ideas expressed herein are for informational and educational purposes only and are based on research conducted and presented solely by the author.  The information presented does not represent the views of the author only and does not constitute a complete description of any investment service.  In addition, nothing presented herein should be construed as investment advice, as an advertisement or offering of investment advisory services, or as an offer to sell or a solicitation to buy any security.  The data presented herein were obtained from various third-party sources.  While the data is believed to be reliable, no representation is made as to, and no responsibility, warranty or liability is accepted for the accuracy or completeness of such information.  International investments are subject to additional risks such as currency fluctuations, political instability and the potential for illiquid markets.  Past performance is no guarantee of future results.  There is risk of loss in all trading.  Back tested performance does not represent actual performance and should not be interpreted as an indication of such performance.  Also, back tested performance results have certain inherent limitations and differs from actual performance because it is achieved with the benefit of hindsight.
“Casino Collapse”: The MGM Edition

The fear associated with “current events” has pushed the implied volatility for options on many stocks to staggeringly high levels.  This creates the potential – and please make careful note of the word “potential” – to sell out-of-the-money put options as a way to, a) generate income, and/or b) buy stock at well below current levels.

See also A Glimpse of Just How Oversold this Market Is

IMPORTANT NOTES: 

*I am not recommending that anyone pursue the strategy I am highlighting (it’s known as a cash secured put) – it is presented merely as “one way to play” in an extremely volatile market clouded in nearly unprecedented uncertainty.  Every trader has to learn the pro’s and con’s and decide for themselves.

*The purpose of the strategy in these articles is to sell far out-of-the-money options when implied volatility – and thus time premiums – are exorbitantly high, and to hopefully buy them back when IV abates.  However, being required to buy the shares if necessary is part of the deal.

*That being said, the goal of the strategy discussed in these articles is not really to “accumulate shares of stock at below current price levels” (although that is one common use for this strategy), rather the belief (hope?) is that someday the cloud of panic will abate – if only temporarily – and that implied volatility levels will plummet from their current stratospheric heights, and many put options will collapse in price as time premium evaporates (due solely to the decline in IV).  At that point – ideally – the options can be bought back early at a profit rather than being held until expiration.

*My opinion is that this strategy should ONLY be used in a “cash secured” manner, i.e., you need to have enough cash in your account to buy the underlying stock at the strike price if necessary.  DO NOT sell naked puts in this market on margin (again, just my opinion) – the risk in this environment is simply too great.

*If you are not willing to buy the underlying stock at the strike price – again, in my opinion – DO NOT sell cash secured puts.  Why?  Because if the price of the stock does decline you either typically have to ultimately buy the stock or buy back the put – most likely at a loss. 

Now on to today’s idea.

Ticker MGM

Like the cruise line industry, the hotel and gaming industry is getting crushed by the impact of the coronavirus.  Nobody knows what the full impact will be and the reality is that things are likely to get worse before they get better.  But as I have said in the past, opportunity is where you find it.

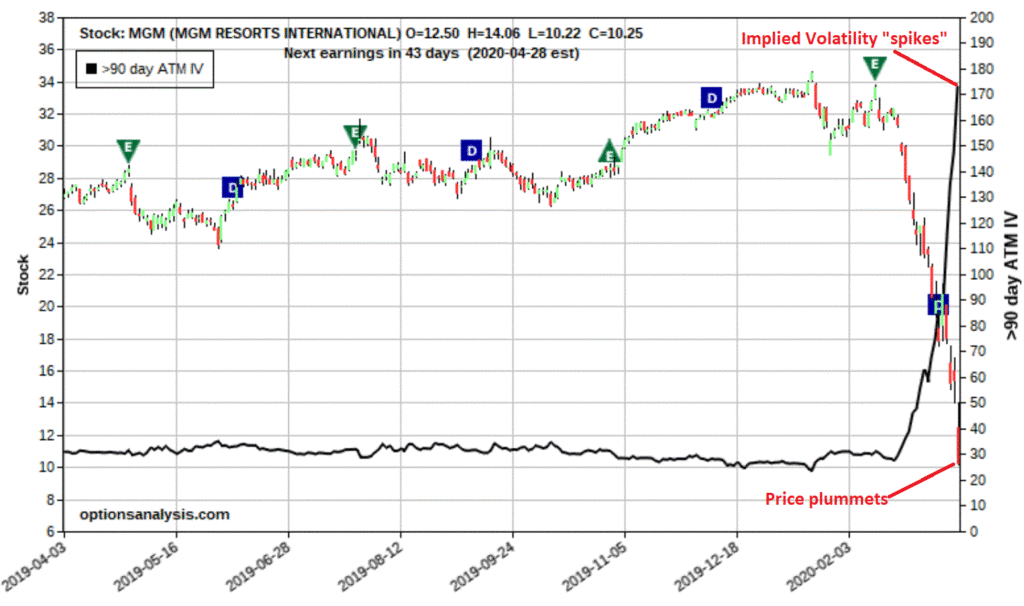
Figure 1 displays the sharp decline in MGM stock AND the massive spike in implied volatility.

Figure 1 – MGM stock price plummets, MGM option implied volatility “spikes” (Courtesy www.OptionsAnalysis.com)

So far, MGM has tanked a full -70% since January 17, including an almost unbelievable -33.6% decline in one day on 3/16/20.  

IMPORTANT NOTE: Under no circumstances would I consider buying shares of MGM stock at this point in time.  That would be a classic potential case of trying to “catch a falling safe”.  Trying to “pick a bottom” in this type of decline is simply foolhardy.  But that is NOT what selling a cash secured put in this case is all about.  

The example trade we will consider for MGM involves:

*Selling 10 June 3 puts @ $0.55

*This action takes in $550 worth of premium ($0.55 x 100 shares x 10 puts)

*The trader needs to have $3,000 in cash in the account to cover the potential purchase of the 1,000 shares of stock if need be (this can include the $550 of premium received, so the investor needs to put up another $2,450 in cash)

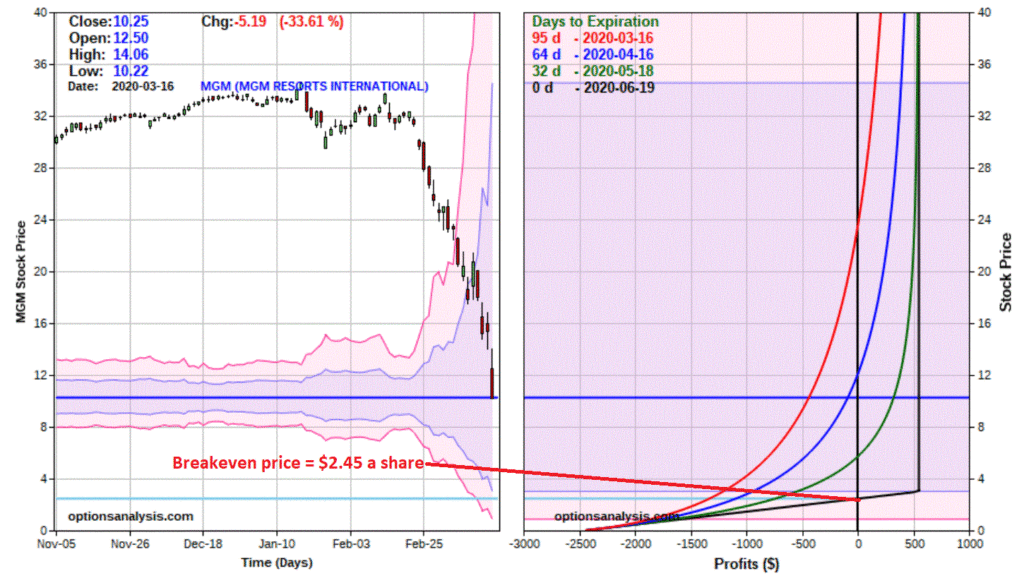
Figures 2 and 3 display the particulars and the risk curves for this trade.

Figure 2 – MGM secured put particulars (Courtesy www.OptionsAnalysis.com)

Figure 3 – MGM secured put risk curves (Courtesy www.OptionsAnalysis.com)

Note that the implied volatility for this option as this is written is an astronomical 248.5%!  In the prior four years (see the most recent 12 months in Figure 1) the typical range for MGM 90-day option IV was 25%-45%. 

Other things to note:

*There are 95 days left until option expiration – we are hoping for a significant decline in IV sometime between now and then

*The option is trading at $0.55 bid/$0.95 ask.  This is an exceedingly wide bid/ask spread.  A trader could use a limit order and try to get filled at a price above $0.55. For sake of simplicity we are assuming a fill using a market order at the bid.

*MGM (as this is written) is trading at $10.25 a share.  The breakeven price for this position is $2.45, another -76% below the current price.

The possible outcomes:

*If MGM completely collapses, we could end up buying 1,000 shares at $3.00 apiece.  But remember, since we took in $0.55 for each option, we sold our effective buy price is $2.45 a share ($3.00 – $0.55 = $2.45)

*Worst case scenario, MGM goes bankrupt, the shares go to $0 and we lose the full $2,450 at risk

*The most likely outcome (hopefully) is that, either:

a) in 95 days, MGM is still above $3 a share the options expire worthless and we keep the $550 in premium.  This works out to a 22.5% return ($550 return / $2,450 cash held to secure the put options) in just 95 calendar days

b) Somewhere along the way implied volatility – and thus the price of the option – plummets, and we can buy back the option early and a price below $0.55 per option.

The bottom line?  If MGM does ANYTHING better than collapsing another 76% in 3 months this trade stands to make a decent return.

Now comes the real question: Is this actually a good idea?  As with the previous examples, that’s not for me to say.

Jay Kaeppel

Disclaimer: The information, opinions and ideas expressed herein are for informational and educational purposes only and are based on research conducted and presented solely by the author.  The information presented does not represent the views of the author only and does not constitute a complete description of any investment service.  In addition, nothing presented herein should be construed as investment advice, as an advertisement or offering of investment advisory services, or as an offer to sell or a solicitation to buy any security.  The data presented herein were obtained from various third-party sources.  While the data is believed to be reliable, no representation is made as to, and no responsibility, warranty or liability is accepted for the accuracy or completeness of such information.  International investments are subject to additional risks such as currency fluctuations, political instability and the potential for illiquid markets.  Past performance is no guarantee of future results.  There is risk of loss in all trading.  Back tested performance does not represent actual performance and should not be interpreted as an indication of such performance.  Also, back tested performance results have certain inherent limitations and differs from actual performance because it is achieved with the benefit of hindsight.
Taking What the Market Gives You – The SLV Edition

Back in November 2019, I wrote this article regarding ticker SLV – an ETF that tracks the price of silver bullion.  The idea was to enter a very low dollar cost position in case something “big” happened in silver.  The expectation at the time – in all honesty – was that silver might “explode” higher prior to January 2021.

Well, the bad news is that things did not work out that way.

The good news is that that turned out to be OK, and now would probably be a time to consider taking a profit.

The Original Position

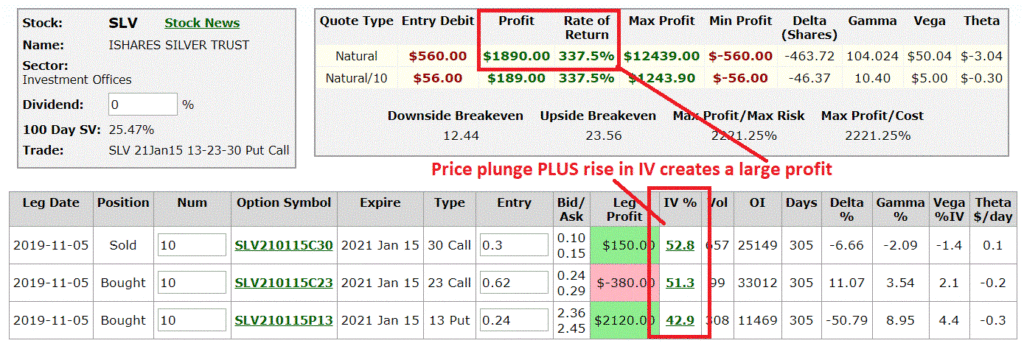
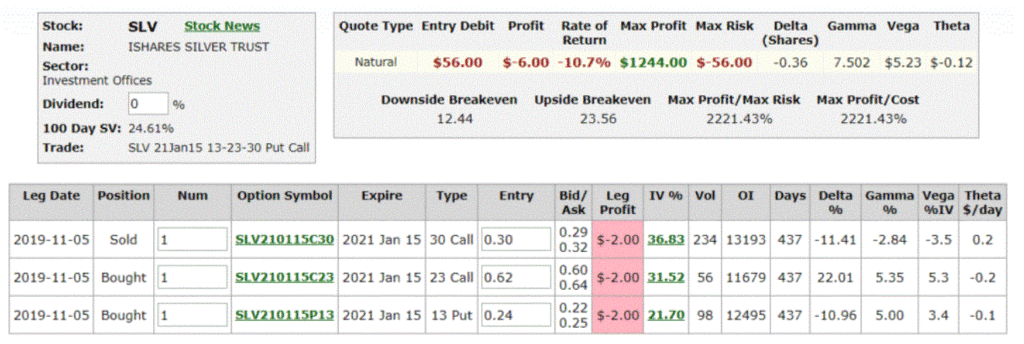
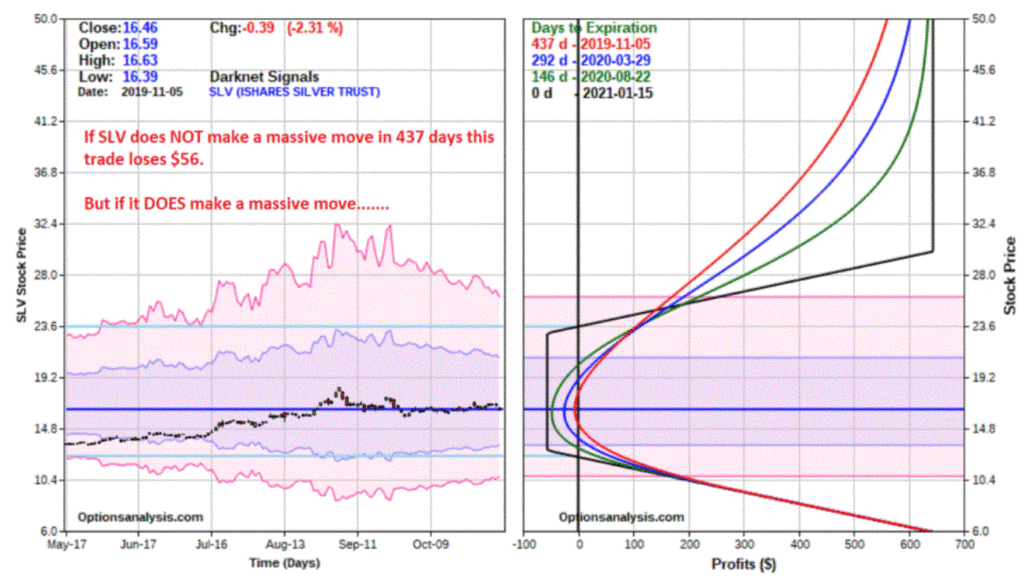
*Figures 1 and 2 display the original position, which involved buying a far out of the money call and put and selling and even further out of the money call.

*The total dollar risk on a 1-lot was $56

*The position had the potential to make a lot of money if silver rallied or declined sharply, and/or if (spoiler alert) implied volatility soared somewhere along the way

Figure 1 – Original position (Courtesy www.OptionsAnalysis.com)

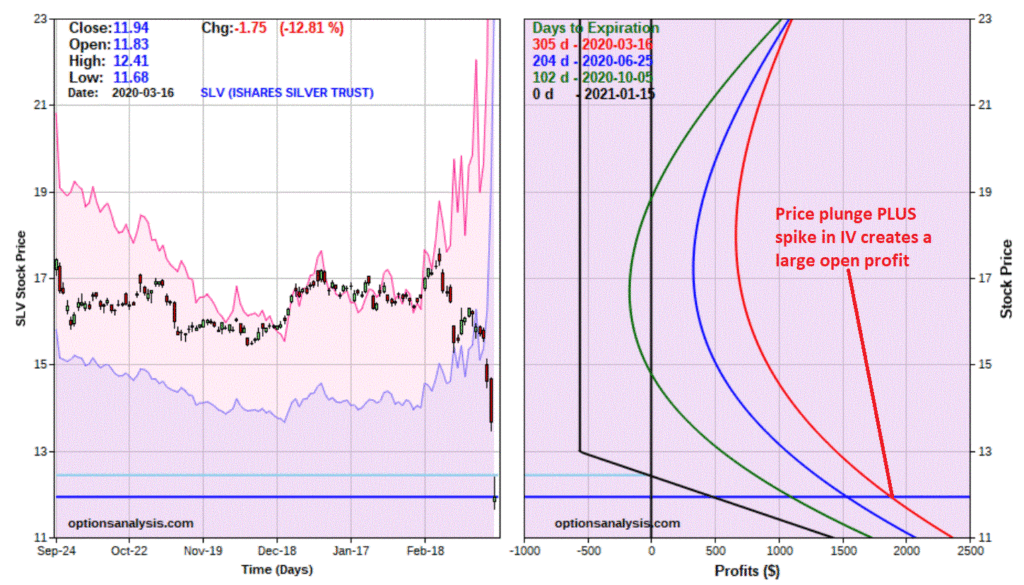
Figure 2 – Risk curves for original position (Courtesy www.OptionsAnalysis.com)

The Current Status

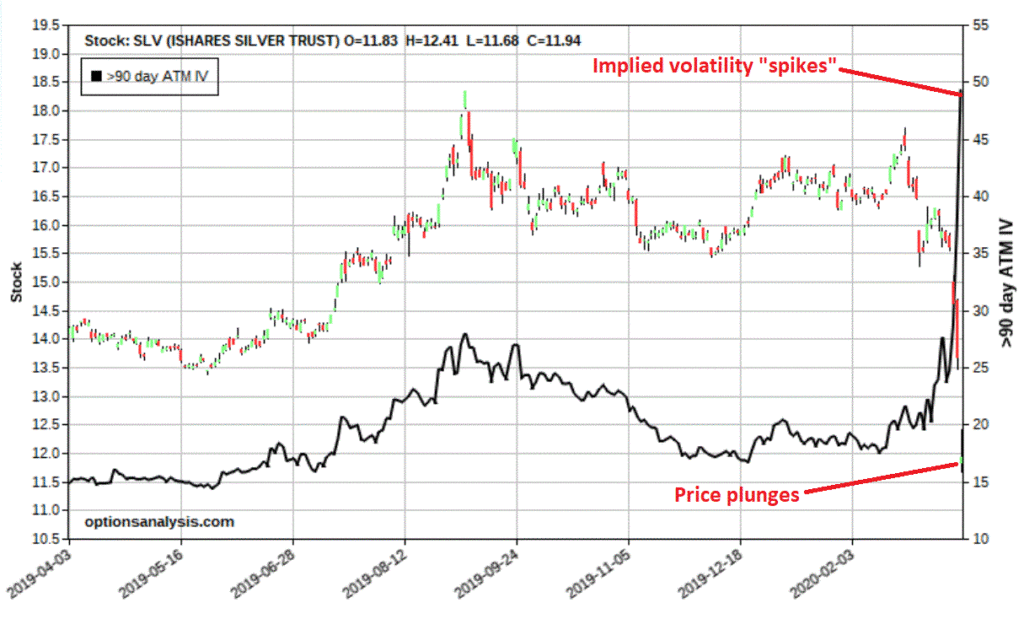
*SLV has since plummeted from roughly $16.56 to under $12 a share

*AND implied volatility has “spiked” higher.  This spike serves to inflate the time premiums built into the longer-term options used in the trade

Figure 3 – SLV tanks, IV spkies (Courtesy www.OptionsAnalysis.com)

Figures 4 and 5 display the current status of this position.

Figure 4 – Current position (Courtesy www.OptionsAnalysis.com)

Figure 5 – Current risk curves (Courtesy www.OptionsAnalysis.com)

As you can see, thanks to the plunge in price and the spike in volatility, this hypothetical position would be sitting with a profit of +337%.

There are many ways that a trade with a profit like this could be adjusted to “lock in a profit and let the rest ride”.  However, volatility spikes tend not to last forever, so this would be a reasonable place for a trader holding this position to “take the money and run.”

Jay Kaeppel

Disclaimer: The information, opinions and ideas expressed herein are for informational and educational purposes only and are based on research conducted and presented solely by the author.  The information presented does not represent the views of the author only and does not constitute a complete description of any investment service.  In addition, nothing presented herein should be construed as investment advice, as an advertisement or offering of investment advisory services, or as an offer to sell or a solicitation to buy any security.  The data presented herein were obtained from various third-party sources.  While the data is believed to be reliable, no representation is made as to, and no responsibility, warranty or liability is accepted for the accuracy or completeness of such information.  International investments are subject to additional risks such as currency fluctuations, political instability and the potential for illiquid markets.  Past performance is no guarantee of future results.  There is risk of loss in all trading.  Back tested performance does not represent actual performance and should not be interpreted as an indication of such performance.  Also, back tested performance results have certain inherent limitations and differs from actual performance because it is achieved with the benefit of hindsight.

“Cruise Collapse” – Part II: The Carnival Edition

To help you decide if you want to go ahead and read this article, take the following short quiz:

Carnival Cruise Lines (CCL) is presently trading at $17.58 (FYI, this article was written on Saturday 3/14/20, by the time you read this, stock and option prices may be very different):

Question #1: Do you think CCL will be trading above $2.25 a share 3 weeks from now?

Question #2: Would you like to make 11.1% in 3 weeks?

If you answered “Yes”, (or at least “Maybe”) to the first two questions, then please continue reading:

In this article, I highlighted one way to potentially take advantage of high volatility in cruise line stocks.  That article focused on selling a very long-term put option (expiring in January 2021) for ticker RCL with the expectation (hope?) that implied volatility would at some point plummet and allow an early profit to be taken.  The alternative was to buy 100 shares of stock at an effective price of $12.70 (the stock was trading at $32.75 at the time).

In this article we will look at something shorter-term.

A Cash Secured Put on Carnival Cruise Lines (CCL)

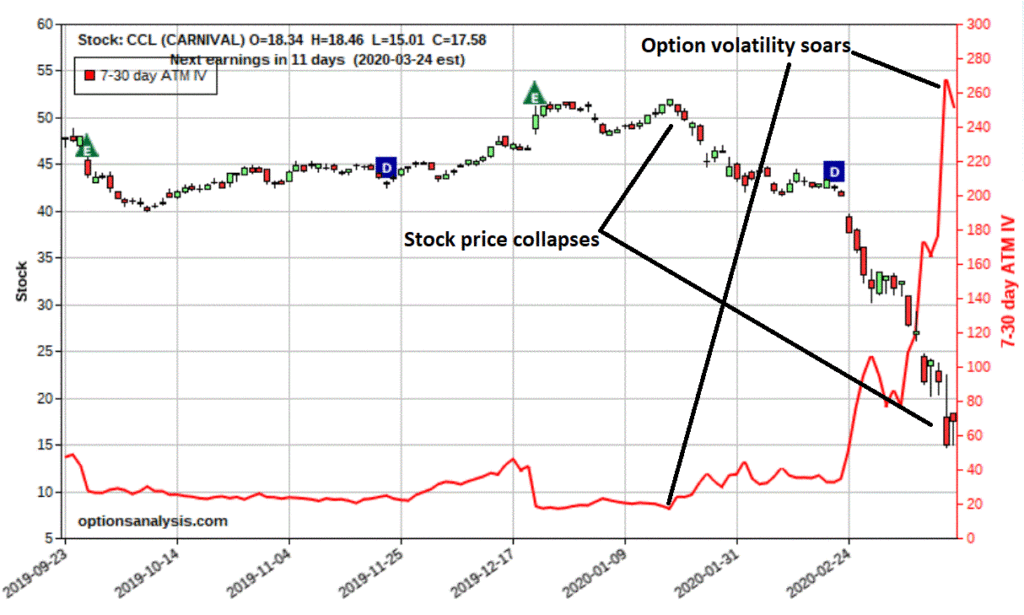
Figure 1 displays the price action for CCL along with the implied volatility for shorter-term options.

Figure 1 – CCL price collapses, CCL options IV soars (Courtesy www.OptionsAnalysis.com)

For CCL we will use the following example trade (remember, these are NOT recommendations, only examples). 

*CCL stock is trading at $17.58 a share

*We will sell 10 April03 2.5 puts at the bid price of $0.25 per option

*These options expire in 21 days

Here are how the numbers work out:

*We need to have cash on hand sufficient to buy 1,000 shares (10 puts x 100 shares each) of CCL.  This comes to $2,500 ($2.50 strike price x 10 puts x 100 shares each = $2,500)

*For selling the 10 puts we take in $250 in premium (short 10 puts at $0.25 x 100 shares per put = $250)

*As a result, our actual risk is $2,250 ($2,500 cash to secure the puts minus $250 in premium received)

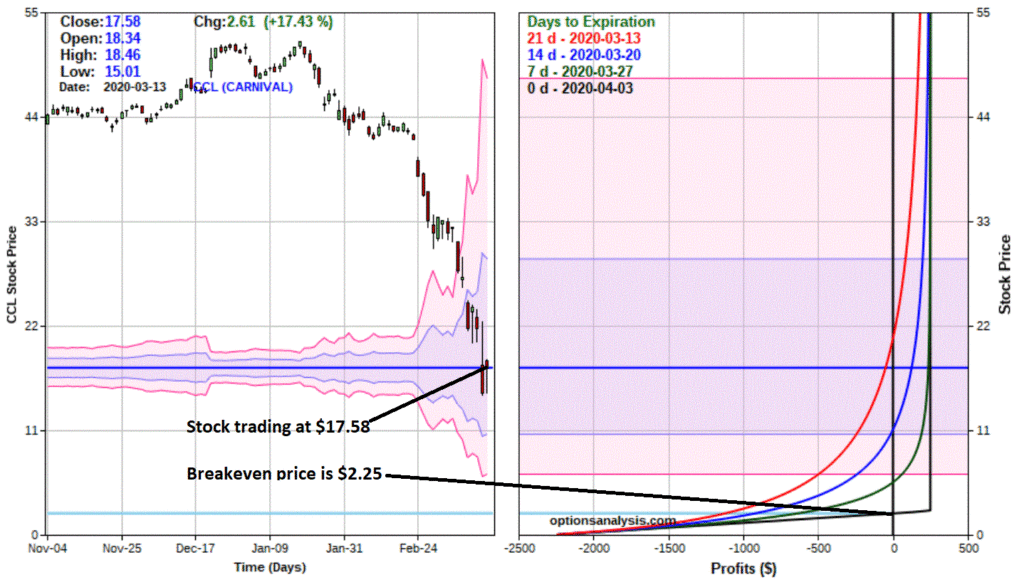
Figure 2 and 3 show the particulars and risk curves

Figure 2 – CCL cash secured put position particulars (Courtesy www.OptionsAnalysis.com)

Figure 3 – CCL cash secured put position risk curves (Courtesy www.OptionsAnalysis.com)

The possible outcomes:

*If CCL completely collapses: we could end up buying 1,000 shares at $2.50 apiece.  But remember, since we took in $0.25 for each option, we sold our effective buy price is $2.25 a share ($2.50 – $0.25 = $2.25)

*Worst case scenario: CCL goes bankrupt, the shares go to $0 and we lose the full $2,250 at risk

*The most likely outcome: (hopefully) is that in 21 days the options expire worthless and we keep the $250 in premium.  This works out to a 11.1% return ($250 return / $2,250 cash held to secure the put options) in just 21 calendar days.

In other words, if CCL does ANYTHING better than collapsing another 86% in 3 weeks this trade makes a decent return.

Summary

The cruise line industry is about to experience a world of hurt.  The astronomical level of implied volatility tells us that there is great uncertainty about just how bad things are going to get.  At the same time, however, implied volatility tells us that option time premiums are at extreme levels.

Lower cruise line stock prices seem to be a foregone conclusion, and I for one would not be outright buying shares and trying to pick a bottom here. But that’s NOT what the example trade above attempts to do. The fundamental question with it is “do you think CCL will NOT collapse another 86% in the next three weeks – and are you willing to risk $2,250 on that opinion?” Nothing more, nothing less.

It is simply an example of one “potential” way to use options to your advantage.

From a real-world trading point of view, one thing to pay attention to is bid/ask levels. For anyone deciding to try to trade these options, limit orders may be essential to getting a decent fill.

But as always, the keys to trading success are:

*Spotting opportunity

*Finding the optimum way to take advantage of said opportunity

High implied volatility has created potential opportunity.  The example trade highlighted stands to make 10%+ as long as CCL stock does not collapse into the abyss in the next three weeks.

Is this actually a good idea?  That’s not for me to say.

Jay Kaeppel

Disclaimer: The information, opinions and ideas expressed herein are for informational and educational purposes only and are based on research conducted and presented solely by the author.  The information presented does not represent the views of the author only and does not constitute a complete description of any investment service.  In addition, nothing presented herein should be construed as investment advice, as an advertisement or offering of investment advisory services, or as an offer to sell or a solicitation to buy any security.  The data presented herein were obtained from various third-party sources.  While the data is believed to be reliable, no representation is made as to, and no responsibility, warranty or liability is accepted for the accuracy or completeness of such information.  International investments are subject to additional risks such as currency fluctuations, political instability and the potential for illiquid markets.  Past performance is no guarantee of future results.  There is risk of loss in all trading.  Back tested performance does not represent actual performance and should not be interpreted as an indication of such performance.  Also, back tested performance results have certain inherent limitations and differs from actual performance because it is achieved with the benefit of hindsight.
One Way to Play the “Cruise Collapse”

With coronavirus now deemed a worldwide pandemic, it is not surprising that the stock prices for cruise ship lines have collapsed. This article does NOT contain a “recommendation”, but only seeks to detail one potential way to play this particular situation.

For the record, possibly the wisest course of action is to stay away from cruise stocks (and cruise ships for that matter, but I digress).  But in every situation, there is opportunity.  Recently I posted this article suggested that the average option buyer should tread lightly, due to the fact the option implied volatility has exploded in recent weeks, vastly inflating the amount of time premium – and thus the price of, options in general.  This makes them “expensive” to buy. 

It can also make them very lucrative to sell.  Like I said, in every situation there is opportunity.

Selling a Cash Secured Put

Let’s look at an example using Royal Caribbean (RCL).  The strategy is called a “cash secured put”. In simple terms:

*You sell an out-of-the-money put option (i.e., one with a strike price below the stock’s price)

*You also make sure that you have enough cash in your account to buy 100 shares of stock at the strike price

Then you wait and one of several things happens:

*The stock is above the option strike price at option expiration and you keep the premium you received when you sold the option

*The stock is below the option strike price at option expiration and you buy the stock at the strike price, but still keep the premium you received when you sold the option – which serves to reduce the effective purchase price of the shares

*You buy back the put option prior to option expiration (usually done if the option can be bought back at a cheaper price than the price it was originally sold)

The idea time to do this is when:

*You are looking at a relatively low-priced stock (so you don’t have to tie up as much cash as you would with a very high-priced stock)

*Implied option volatility is extremely high (because that is when the most premium is available)

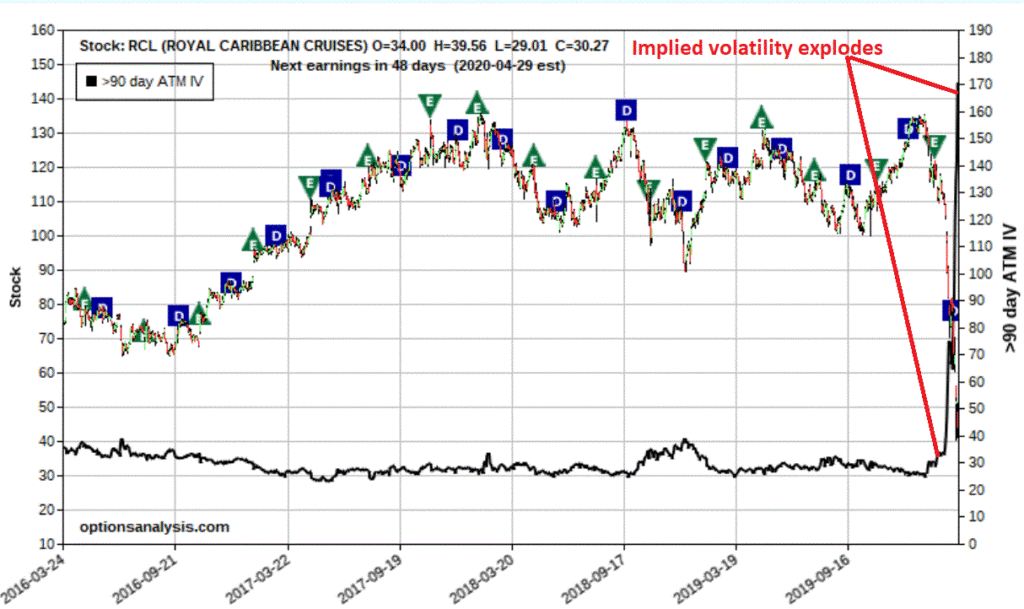
Figure 1 displays RCL stock price and 90+-day option implied volatility (black line) four about 4 years.

The historical range is roughly 30% to 40% – now > 150%!

Figure 1 – RCL price and implied volatility (High IV makes options “expensive”) (Courtesy www.OptionsAnalysis.com)

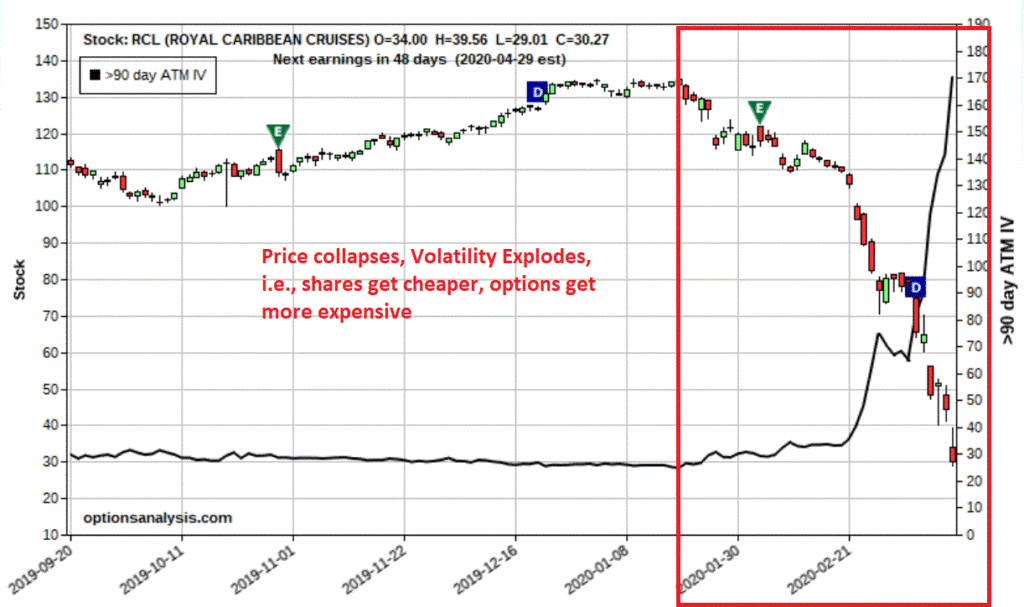
Figure 2 zooms in on Figure 1

Figure 2 – RCL price and implied volatility (Courtesy www.OptionsAnalysis.com)

A few things to note:

*RCL has obviously “crashed” in price

*Implied volatility is at potentially a once in a lifetime level (i.e., RCL options are “expensive”)

The problem with just buying RCL stock right here is that no one knows “how low is low”.  So, we will go a different route, but first a little more pesky “options education.”

A Quick Lesson in The Effect of Changes in Volatility on Time Premium

*Longer-term options have more time premium built into their price than shorter-term options.  This is simply because an option writer is going to demand more premium to write (and be exposed to the risk of being short an option) a longer-term option than a shorter-term option.

*The option Greek “Vega” tells us how much time premium (in dollars) an option (or combined position) will gain or lose if implied volatility rises one full percentage point.  More on this in a moment.

*Longer-term options have a higher Vega than shorter term options, and their prices will swing more based on changes in IV that shorter-term options.

An RCL Hypothetical Position

*Just a reminder, I am not “recommending” this trade, just using it as an interesting (well, OK if you are an option geek like me) example.

*For our trade we are going to sell (or sell short, or “write”) the January 2021 22.5 strike price put option.

Figure 3 – RCL Cash Secured Put (Courtesy www.OptionsAnalysis.com)

Things to note:

*This option is trading at an implied volatility (IV) of 140.2% (glance again at Figures 1 and 2 to note the historical range for RCL IV)

*This option does not expire until January 15, 2021, or 309 days from now

*This option has a “Vega” of -$7.09 (this means that IV rises one full percentage point this position will lose roughly -$7.09 and if IV FALLS one full percentage point this position will gain roughly $7.09. In other words, a decline in volatility will work in our favor)

*This option has a “Theta” of $1.82 (this means that we will gain roughly $1.82 per day due to time decay, i.e., the time premium for the option will decline by that amount per day)

*As this is written, RCL is trading at $30.27 a share

*We are going to assume that a limit order is used as that we get filled at the midpoint of the bid/ask range, and sell the put option at $9.80, thereby taking in $980 in premium

*Since we are selling a 22.5 strike price put, it means we need to have $2,250 (22.5 x 100 shares) in cash in our trading account to cover the potential cost of buying the shares

*However, this cost is reduced by the fact that we received $980 in premium for writing the option. 

*This means that – in theory – if RCL is trading below $22.50 a share (or 25.7% below the current stock price) on January 15, 2021, we would be required to buy 100 shares of RCL at $22.50 a share.  Again, however, because we received the premium, our effective purchase price would be:

Option Strike Price = 22.5 x 100 = $2,250

Minus the option premium received = $9.80

Net Cost = $12.70 a share or $1,270 for 100 shares

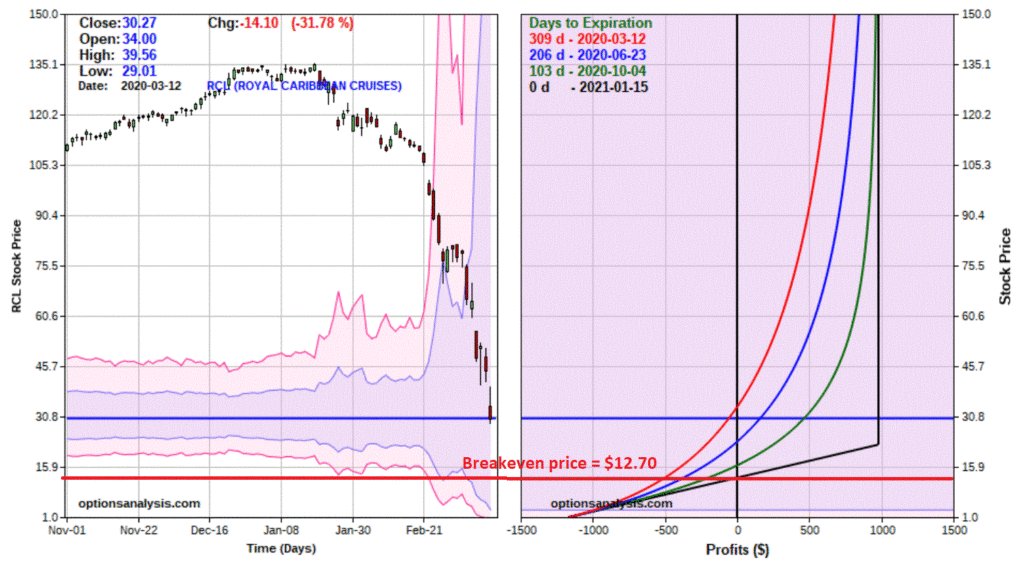
Figure 4 displays the risk curves for this position, and you can see the breakeven price of $12.70 a share.

Figure 4 – RCL short put risk curves

Two Other Possibilities

The big potential negative to note is this: If RCL is under the strike price at option expiration you must buy the shares at $22.50.  Even if RCL fell to $1 a share you still need to buy the shares at $22.50 (although again, your net cost is $12.70).  $12.70 looks pretty good when the stock is trading at $30.27 a share.  But the key risk factor to note in this trade is that YES, you can lose money if the stock keeps falling.

For the record, in the worst case scenario, RCL goes bankrupt and the trader loses the entire $2,250.

The other possibility is to buy back the put option before it expires.  This is once again where implied volatility becomes an important factor.  Let’s suppose the following:

*At some point the RCL stock price decline “levels off”, i.e., it stops plunging for awhile

*When that happens, chances are great that implied volatility will decline.  In this case – refer back to Figures 1 and 2 – implied volatility can fall a very long way

Now remember our discussion earlier (or better yet refer to the discussion in this article) about changes in IV.  This position has a Vega of -$7.09, which means that it will lose a lot of time premium if IV falls.

(TECHNICAL NOTE: Greek values change from day to day as time passes and the price of the stock and the option fluctuate)

Example of Buying Back the Put Option Early

For example’s sake, let’s assume:

*Two months’ go by

*RCL stock price is unchanged

*IV falls from 140% to 40%

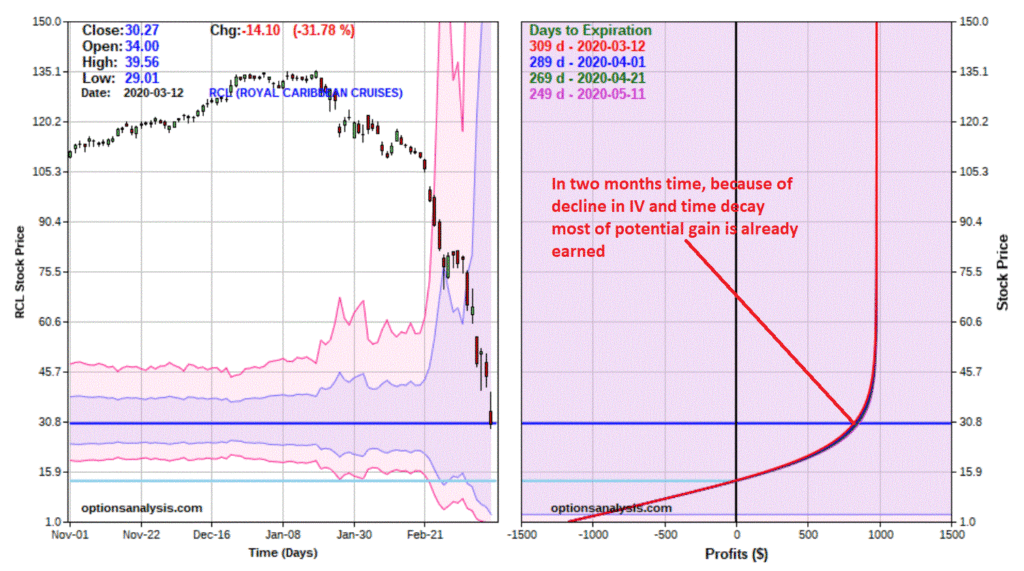
Because of time decay and the sharp decline in IV, a large portion of the current time premium will evaporate.  This could give us the opportunity to buy back the put option at a profit and close the trade, rather than waiting around for January 2021.

Figure 5 – The effect of IV falling from 140% back to 40% (Courtesy www.OptionsAnalysis.com)

Figure 6 – RCL risk curves two months later assuming IV falls to 40% (Courtesy www.OptionsAnalysis.com)

Summary

Opportunity is where you find it.  But everything entails risk.  The example trade presented here has the potential to take advantage of the current levels of fear surrounding RCL stock by selling a far out of the money put option and ultimately either buying it back early at a profit or buying shares of RCL at $12.70 a share.

But remember, if RCL drops below that price, large losses can still occur

Jay Kaeppel

Disclaimer: The information, opinions and ideas expressed herein are for informational and educational purposes only and are based on research conducted and presented solely by the author.  The information presented does not represent the views of the author only and does not constitute a complete description of any investment service.  In addition, nothing presented herein should be construed as investment advice, as an advertisement or offering of investment advisory services, or as an offer to sell or a solicitation to buy any security.  The data presented herein were obtained from various third-party sources.  While the data is believed to be reliable, no representation is made as to, and no responsibility, warranty or liability is accepted for the accuracy or completeness of such information.  International investments are subject to additional risks such as currency fluctuations, political instability and the potential for illiquid markets.  Past performance is no guarantee of future results.  There is risk of loss in all trading.  Back tested performance does not represent actual performance and should not be interpreted as an indication of such performance.  Also, back tested performance results have certain inherent limitations and differs from actual performance because it is achieved with the benefit of hindsight.
A Great Time for the “Average” Option Buyer to Tread Lightly

The reality is that there are many terrific opportunities available to option traders at the moment.  Unfortunately, there are mostly NOT the kind that the majority of individual traders are used to – or should necessarily be pursuing. 

There are two areas of concern:

*Astronomically high implied volatility (more on this in a moment)

*Excessively large bid/ask spreads

A quick and dirty way to understand implied volatility:

*An option trading “in-the-money” its price is comprised of “intrinsic value” (i.e., the amount be which it is in-the-money) and “extrinsic value”, more commonly known as “time premium.”

*An option trading “out-of-the-money is comprised solely of time premium.

*Think of time premium as the amount that the option buyer pays the option write in order to induce the option writer to assume the risk of selling the option in the first place.

*The best analogy is the “insurance premium” one. You pay a premium to an insurance company in order to induce them to write you an insurance policy.  Likewise, you pay (time) premium to an option writer in order to induce them to write an option that you can buy.

*Now let’s look at it from the perspective of the option writer.  If the market is calm and quiet and there just isn’t much going on you will still demand a certain price from the option buyer before you will assume the risk of writing an option. 

*OK, now if the market and/or the specific security you are trading is wildly volatile with large price swings, are you going to demand more time premium or less in order to assume the risk of writing an option?  The question answers itself. 

*So, when things get crazy – and as demand from panicked option buyers increases, option premiums can increase significantly.  The way to identify whether this volatility is high, low or somewhere in between is to look at the implied volatility for the options on that stock. 

*If IV is exceedingly low that means that options are “cheap”, i.e., time premiums are low (this can be a good time to buy premium)

*If IV is exceedingly high that means that options are “expensive”, i.e., time premiums are high (this can be a good time to sell premium for traders who are so inclined)

IMPORTANT POINT: If you are thinking that because of the large price movements that you will buy a call or put option and making a killing – well, you may be able to if the underlying security moves far enough in price, BUT:

*You will be paying an extremely high price for the privilege of buying that option (repeating now, if implied volatility is extremely high – which it is – you will be paying a lot of time premium)

*In addition, if IV subsides while you hold that long call or put, time premium may collapse, thereby sharply decreasing the value of your option.

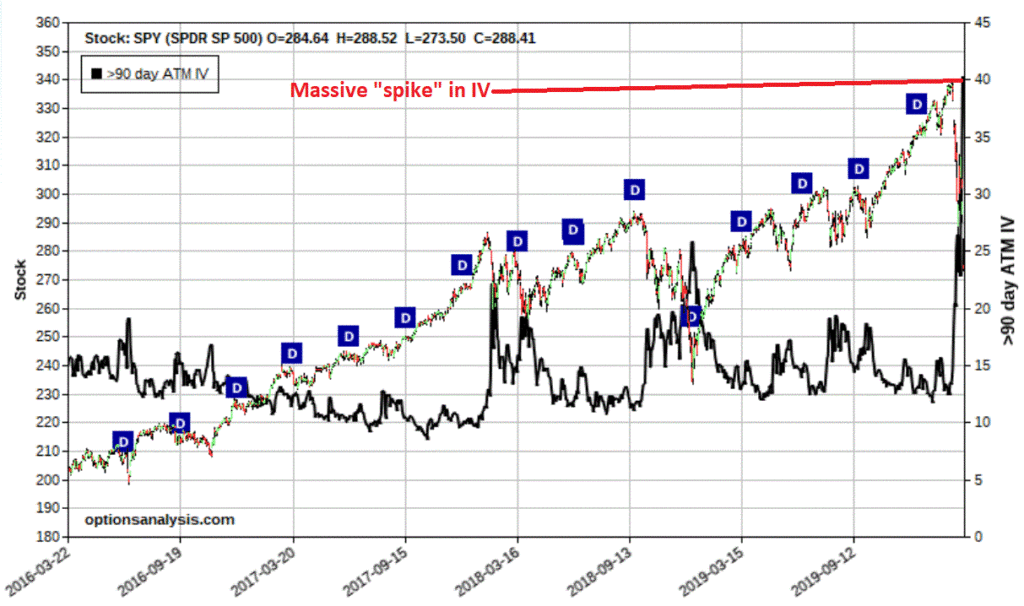
To put things in perspective, the IV for options on ticker SPY (an ETF that tracks the S&P 500 Index) over roughly four years is displayed as the black line in Figure 1.

Figure 1 – SPY with Implied Volatility (IV) “to the moon” (Courtesy www.OptionsAnalysis.com)

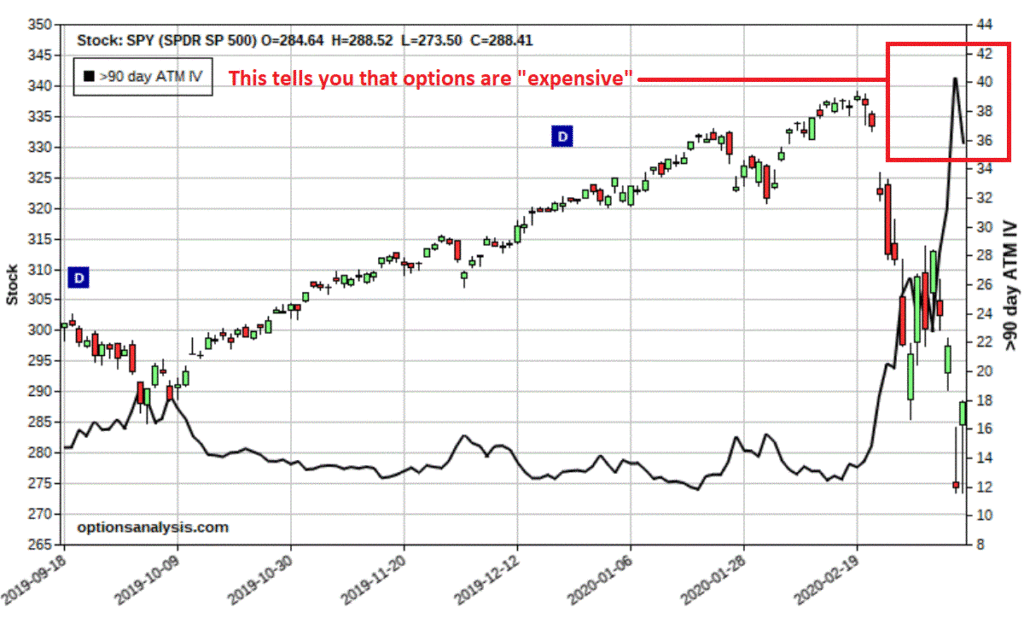
Figure 2 zooms in on the most recent 120 days in Figure 1.

Figure 2 – SPY with IV (Courtesy www.OptionsAnalysis.com)

Notice the huge spike in IV – the black line?  This is your warning that time premium levels are “crazy” high.  Let’s look at what this means to a trader. 

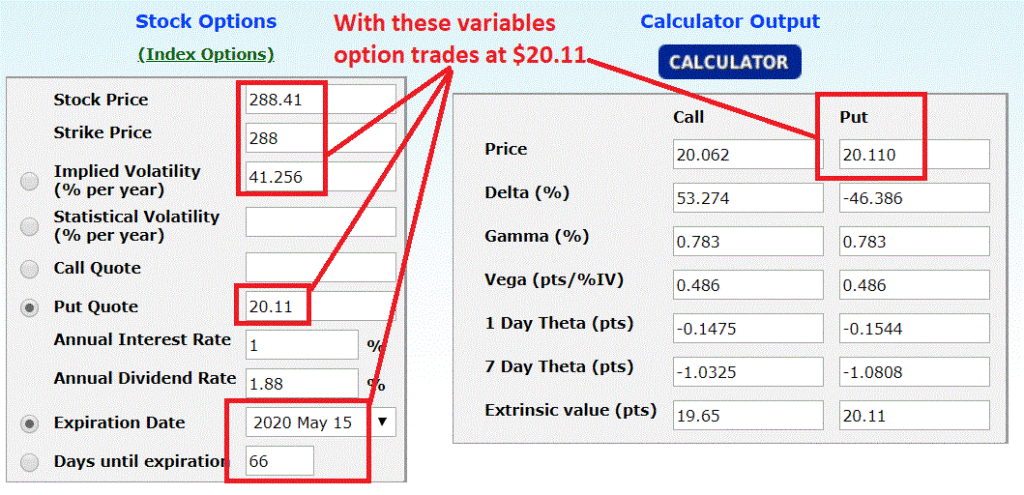
Let’s say you expect SPY to resume its recent decline, between now and May options expiration.  You might buy the May 288 put @ $20.11 (cost – $2,011). The current IV for this option is 41.26.  See Figure 3.

Figure 3 – SPY May 288 put: Cost = $20.11, Implied Volatility = 41.26% (Courtesy www.OptionsAnalysis.com)

Figure 4 displays the current status of the SPY May 288 put, i.e.,

*SPY trading at 288.41

*The option trading at $20.11

*Implied Volatility is 41.26

Figure 4 – Current status of SPY May 288 put (Courtesy www.OptionsAnalysis.com)

The All-Important Effect of Changes in Implied Volatility

Now let’s get down to the nitty gritty that really matters.

First, take another look at Figure 1 and note that “typically” following “spikes” in IV:

*The market “tends” to rebound, AND

*IV tend to decline sharply

So here is a though experiment.  Let’s say:

*SPY is exactly unchanged 2 weeks from now AND

*IV has fallen 50% back into the “normal” 20% range

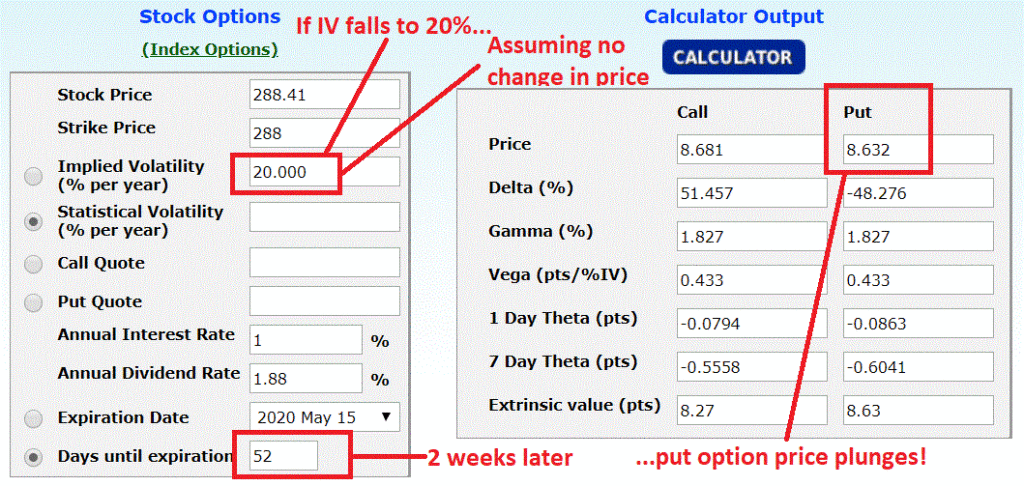
In the left-hand side of Figure 5, the only numbers that have changed are:

*Implied Volatility is down to 20% (from 41.62%)

*Days until expiration is down from 66 to 52

Figure 5 – SPY May 288 put AFTER IV declines ;(Courtesy www.OptionsAnalysis.com)

Note the change to the price of the put option:  It fell from $20.11 to just $8.63!  This is typically referred to as a “volatility crush.”

This is with NO CHANGE IN PRICE – SPY is at the same price it was 2 weeks ago, and yet solely because the market – and investor’s fears – have “calmed down”, this option – in theory – could lose -57% in value.

IMPORTANT POINT:

None of this means that you cannot make money by buying a put option (for the record, if SPY fell 10% in price in two weeks with no change in IV, the May 288 put would be worth roughly $34 per contract, a 69% gain).  But here is the point:

*Long-term success in option trading comes from putting the odds as much on your side as possible on a trade-by-trade basis. 

*Buying options when implied volatility levels are at extremely high levels DOES NOT constitute putting the odds on your side.

If you are a trader who typically just buys calls and puts, you might consider either scaling back a bit – or um, self-quarantining completely – for a little while until IV’s come back to earth.

Jay Kaeppel

Disclaimer: The information, opinions and ideas expressed herein are for informational and educational purposes only and are based on research conducted and presented solely by the author.  The information presented does not represent the views of the author only and does not constitute a complete description of any investment service.  In addition, nothing presented herein should be construed as investment advice, as an advertisement or offering of investment advisory services, or as an offer to sell or a solicitation to buy any security.  The data presented herein were obtained from various third-party sources.  While the data is believed to be reliable, no representation is made as to, and no responsibility, warranty or liability is accepted for the accuracy or completeness of such information.  International investments are subject to additional risks such as currency fluctuations, political instability and the potential for illiquid markets.  Past performance is no guarantee of future results.  There is risk of loss in all trading.  Back tested performance does not represent actual performance and should not be interpreted as an indication of such performance.  Also, back tested performance results have certain inherent limitations and differs from actual performance because it is achieved with the benefit of hindsight.
When You Are Done Panicking, Take a Look at Energy

Fighting fear is one of the most difficult tests we humans face.  Whether it is corona virus, a plunging stock market, [Your most hated presidential candidate here] occupying the White House in January 2021, or one of countess other things, it is pretty easy to find things to be afraid of.  Maybe it is just a perception but for whatever reason, it seems that society today is less able to handle their collective fears.  I saw it aptly put this way somewhere:

1941: “We have nothing to fear, but fear itself”

2020: “AAAAAAAAAAAAAHHHHHHHHHHHHHH”

Maybe that’s not entirely accurate.  But it sort of feels like it at the moment.

For the purposes of this blog, let’s stick to the financial markets. 

The bond market:

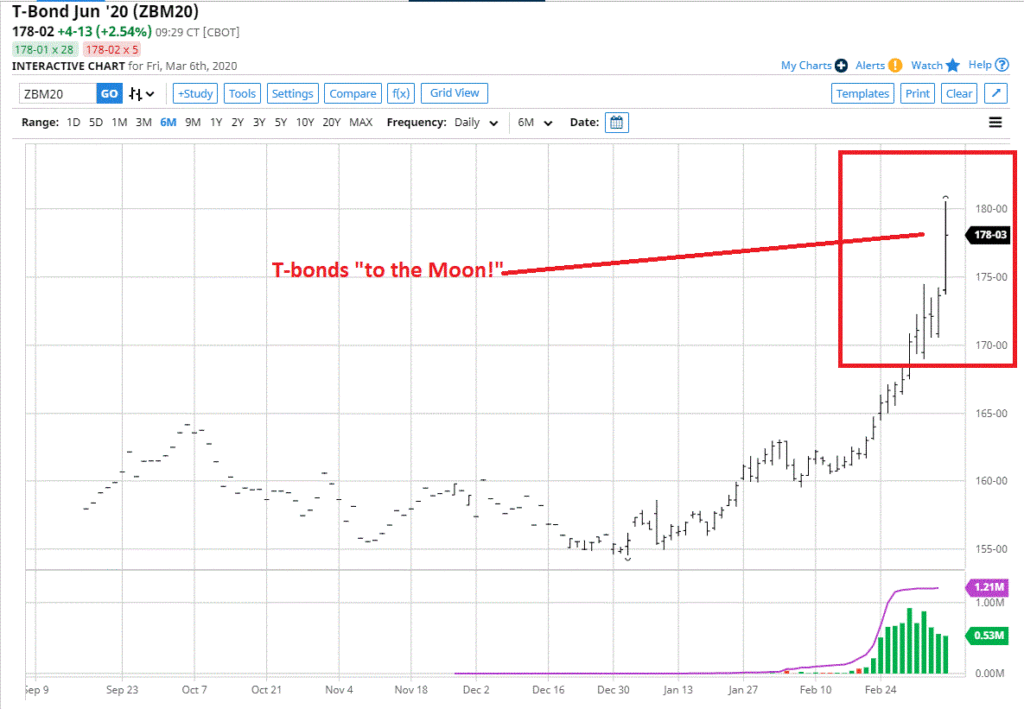
*If you are holding bonds at the moment you are doing great – particularly if you are holding long-term bonds.  With Central Banks pushing interest rates down, yields are plunging and bonds are soaring. 

*But “chasing things” that are moving abnormally well is typically not an investors best move.  What is happening at this moment in long-term treasuries is very abnormal and I would be hesitant to chase that move right here.

Figure 1 – Long-term treasuries appear to have achieved “Lift Off” – Be careful here (Courtesy: www.BarChart.com)

*Given that the financial markets are likely to remain volatile for some time, I personally still tend to migrate to intermediate-term bonds due to their much lower volatility relative to long-term treasuries. 

The U.S. Dollar:

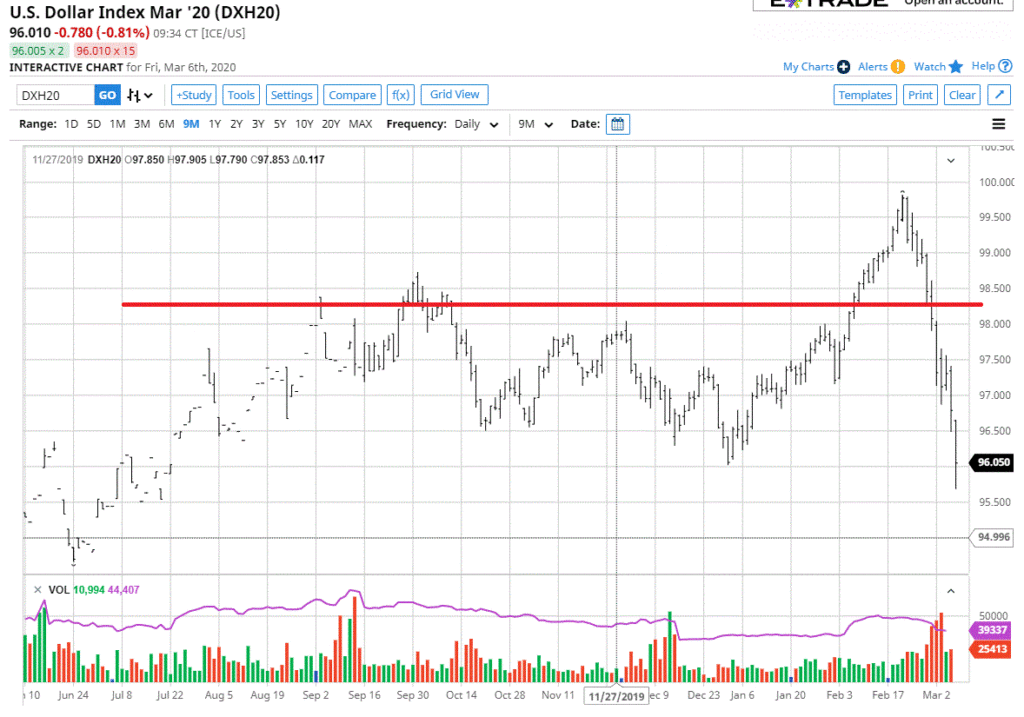
*Just a reminder that support and resistance levels can be very useful in identifying opportunities – as well as risks.  In this article and this article back in 2019 I noted that the U.S. Dollar was running into some serious resistance.  I make no claim to have “called the top” (because I never do) but it did appear to be an area of high risk for the dollar. 

Figure 2 – The U.S. Dollar (Courtesy: www.BarChart.com)

The stock market:

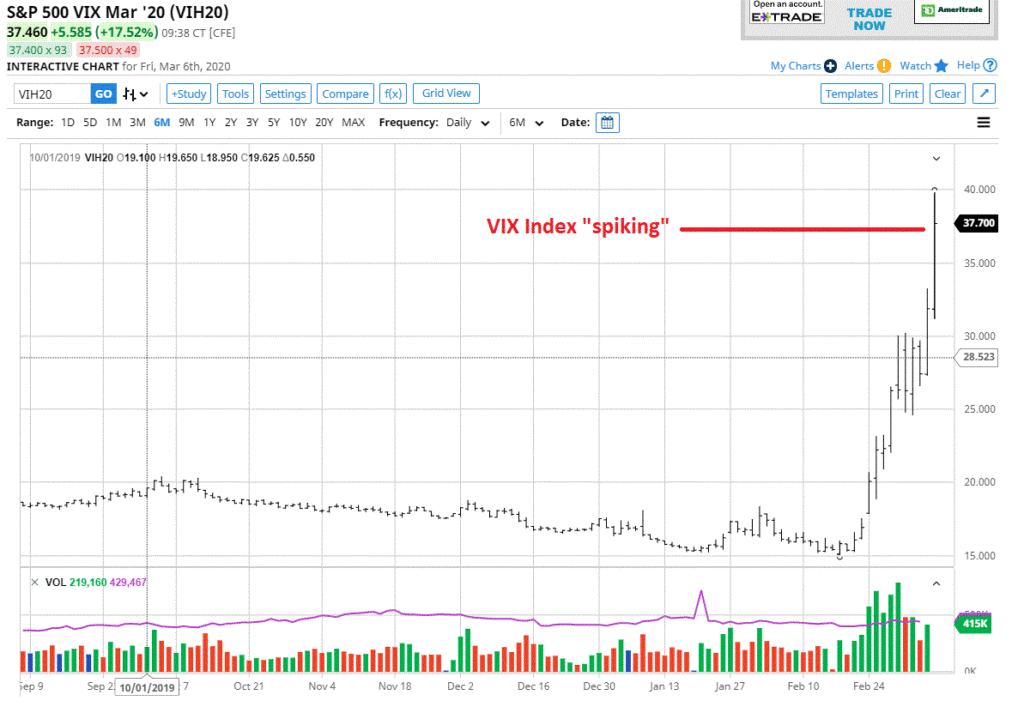
*Fear is rampant as I write, with all of the major averages plunging and the VIX Index “spiking” higher again. 

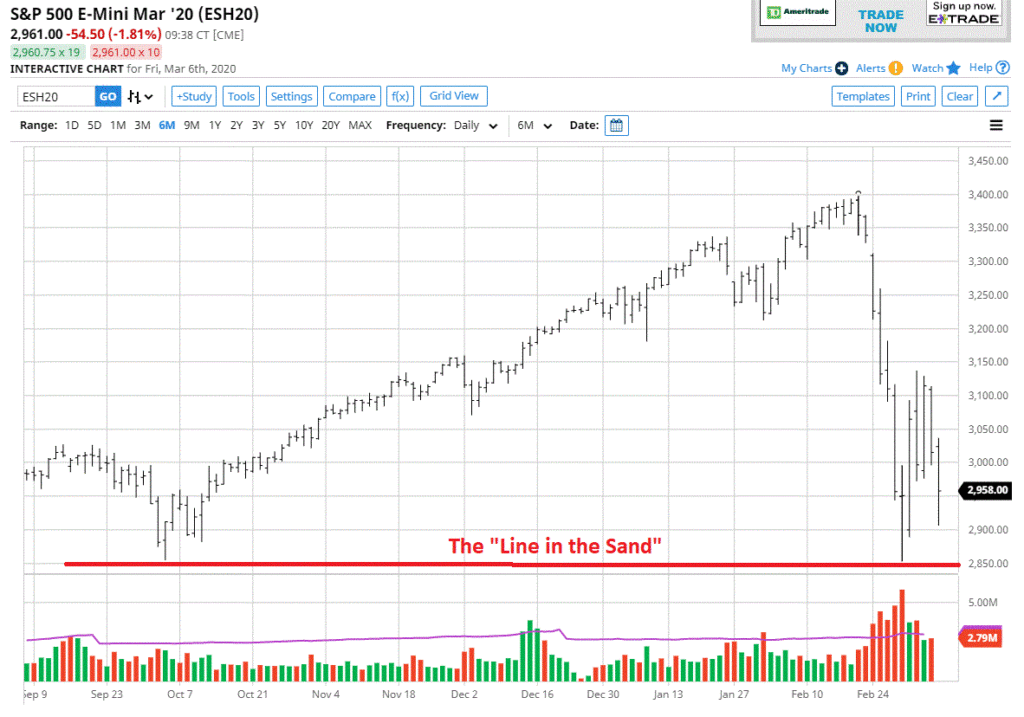
*Ignore the headlines and watch the previous lows!  While the VIX Index is soaring to a new high for this move, the major indexes have yet to take out their lows from last week. 

*I am certainly not going to say that it won’t happen.  The most likely outcome is continued volatility for a while with almost certainly a test of th recent low and/or even lower lows before the ultimate bottom.  

*My point is simply that if you look at the headlines today you will get that “Armageddon Feeling”, despite the fact that – technically speaking – the market is still higher than it was during the end of February plunge.

*Repeating – watch the market and NOT the news!

Figure 3 – VIX Index is soaring…. (Courtesy: www.BarChart.com)

Figure 4 – …but watch the previous lows on SPX (Courtesy: www.BarChart.com)

Energy Stocks:

*My gut still tells me that we are in an area of great opportunity for buying energy stocks. 

*HOWEVER, buying in when prices plunging to new lows is not my style.  Still, I am paying close attention.

*Reason 1: In this article there is a discussion arguing that the age of fossil fuels – for better or worse – is NOT going to end anytime soon

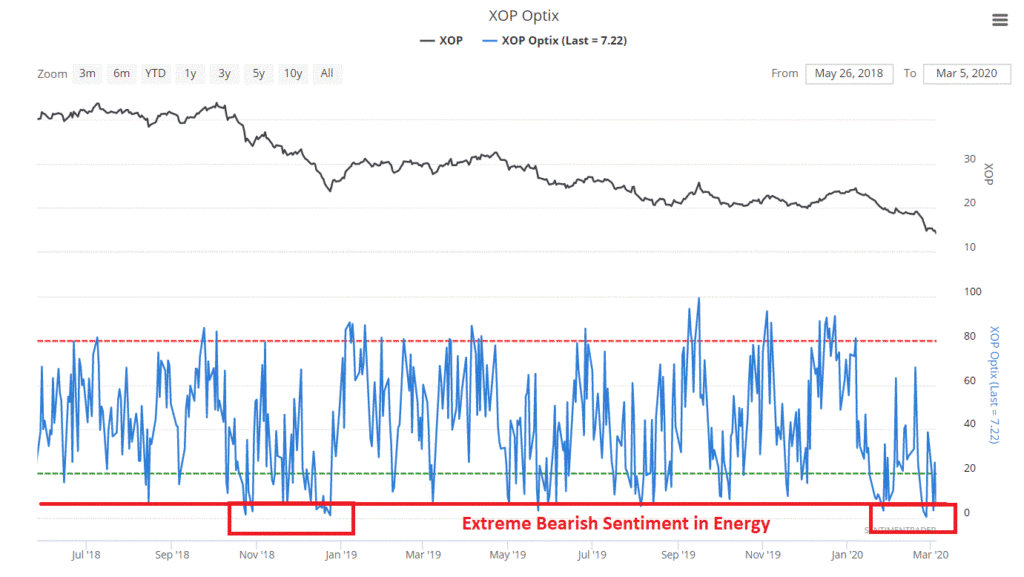
*Reason 2: Energy stocks are universally loathed as evidenced by the sentiment chart in Figure 5 from www.sentimentrader.com

Figure 5 – Trader Optimism for ticker XOP (Courtesy Sentimentrader.com)

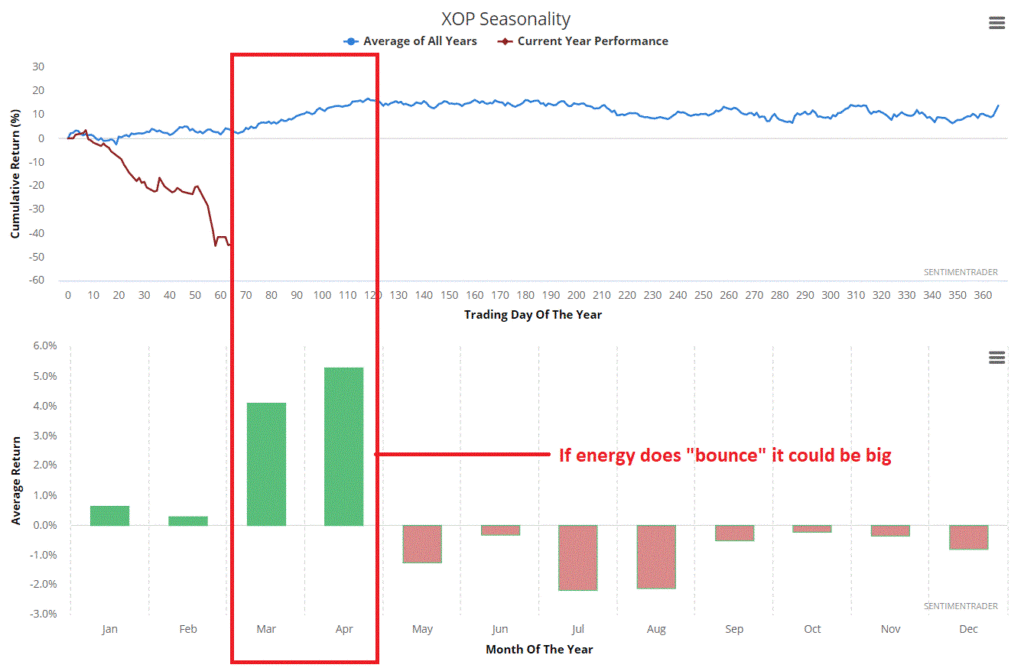
*Reason 3: We are in a period that on a seasonal basis is typically favorable for energy stocks.  It may or may not work this time, but the point is that given the current oversold status, the extremely negative sentiment and the time of year, if energy stocks turn it could happen very quickly.  So keep an eye open.

Figure 6 – XOP Seasonality (Courtesy Sentimentrader.com)

Summary

Repeating from previous articles:

*Keep your head screwed on straight

*Regarding pandemics and stock markets, adopt a “hope for the best, prepare for the worst mentality”

*If you believe you are overexposed in the market then make a plan for when and what and how much you should sell.  Then follow your plan and DO NOT look back in regret

*If you want to put your head in the sand and just hold on forever, fight that urge (the time will come to NOT “ride it out”)

*If you have cash to invest – don’t try to be a hero, but don’t be a total wimp either

Jay Kaeppel

Disclaimer: The information, opinions and ideas expressed herein are for informational and educational purposes only and are based on research conducted and presented solely by the author.  The information presented does not represent the views of the author only and does not constitute a complete description of any investment service.  In addition, nothing presented herein should be construed as investment advice, as an advertisement or offering of investment advisory services, or as an offer to sell or a solicitation to buy any security.  The data presented herein were obtained from various third-party sources.  While the data is believed to be reliable, no representation is made as to, and no responsibility, warranty or liability is accepted for the accuracy or completeness of such information.  International investments are subject to additional risks such as currency fluctuations, political instability and the potential for illiquid markets.  Past performance is no guarantee of future results.  There is risk of loss in all trading.  Back tested performance does not represent actual performance and should not be interpreted as an indication of such performance.  Also, back tested performance results have certain inherent limitations and differs from actual performance because it is achieved with the benefit of hindsight.
Please Take A Moment to Locate the Nearest Exit (Part III)

In Part I and Part II I laid out my own personal expectation that a bear market of some significance may well occur between the end of 2019 and the middle of 2022.  Then of course, it all seemed to happen in a week.  Now the reality is that I certainly did not “call the top”.  In the articles linked above I identified the “current trend of the market” as “bullish”, which was technically correct. 

Let explain my own personal “Big Picture, incredibly rudimentary” method for designating the current trend of the stock market as bullish or bearish.  In no particular order:

*Was last month’s closing price for the S&P 500 Index above its 10-month moving average? (As of 2/28/2020 = NO)

*Are at least 2 of the following indexes – Dow Industrials, S&P 500, Nasdaq 100, Russell 2000 – above their respective 200-day moving averages? (As of 9:40 CST on 3/4/2020 = YES, the S&P 500 and the Nasdaq 100)

*Is the current month November through May? (YES)

*As explained in this article, has the S&P 500 Index NOT gone 3 months without making a new high, then taken out the low of the intervening 3 months? (YES)

If:

*3 or 4 of these are bullish, then I am bullish

*2 are bullish, I typically give the bullish case the benefit of the doubt

*If only 1 is bullish I raise some cash 

*If 0 are bullish we are in a bear market and I play some serious defense

As I write, 3 of the 4 still qualify as “bullish” (the S&P 500 Index did close February below its 10-month average, so that one is now bearish), so – despite the hysterics of the last week of February – I have no choice but to call myself “bullish.”

Also, on the plus side, a ton of market indicators reached vastly oversold levels during the selloff (see here for one example).  This in no way guarantees a rebound nor an immediate resumption of the uptrend, but it is a hopeful sign. 

If history is a guide:

*We will likely see a lot of volatility in the weeks ahead – big up days and optimistic headlines, followed by another plunge and more apocalyptic prognostications

*The market should work itself higher in the months ahead following the massive oversold readings I just mentioned

So, the good news is that long-term investors may be OK just sitting tight for now.  The bad news is that I still think there is more potential trouble waiting “down the road.” And I urge investors to be vigilant and NOT to adopt the “I am just going to ride it out no matter what” mentality.

What to Do Now

Its probably OK to “exhale” a little bit after last week, but DO NOT get complacent. 

Keep an eye on the four trend-following indicators I mentioned above.  If and when the market truly starts to “roll over” it will – in my opinion – absolutely, positively be time to “play some defense”. 

A little more on why I remain vigilant (much of which is detailed here and here):

*Valuation levels remain high – which means there is still plenty of downside risk

*The decennial “Early Lull” remains a concern (the first 2.5 years of decades starting with a presidential election have seen the Dow lose ground 6 times in row, with an average loss in the -14% range)

*While I think Coronavirus fear is insanely overhyped, it is too soon to say for sure that it won’t have a significant impact on the worldwide economy

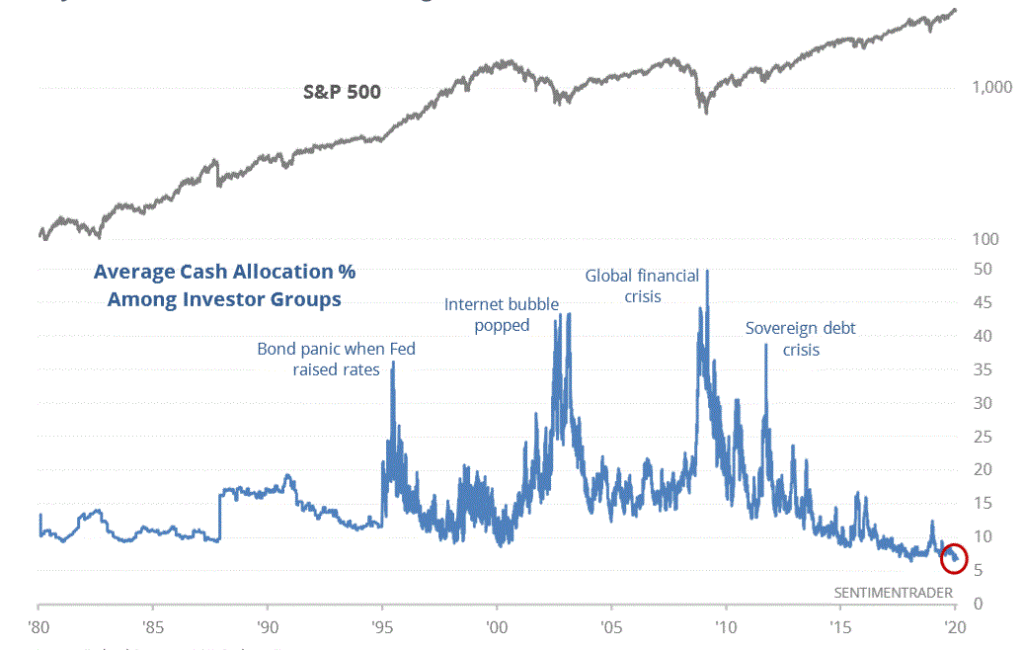
*Lastly, one thing I have not mentioned before is the dearth of available cash.  See Figures 1 and 2 from www.sentmentrader.com

Figure 1 – Cash allocations across investor groups (as of 2/5/2020) (Courtesy Sentimentrader.com)

Figure 2 – Average Cash Allocation % Among Investor Groups (as of 2/5/2020) (Courtesy Sentimentrader.com)

These numbers may have jumped a little bit during the recent selloff, but not likely substantially so. Bottom line: there is not a ton of “buying power” sitting around to propel the stock market indefinitely higher.

Summary

Repeating from previous articles:

*Keep your head screwed on straight

*Regarding pandemics and stock markets, adopt a “hope for the best, prepare for the worst mentality”

*If you believe you are overexposed in the market then make a plan for when and what and how much you should sell.  Then follow your plan and DO NOT look back in regret

*If you want to put your head in the sand and just hold on forever, fight that urge (the time will come to NOT “ride it out”)

*If you have cash to invest – don’t try to be a hero, but don’t be a total wimp either

Jay Kaeppel

Disclaimer: The information, opinions and ideas expressed herein are for informational and educational purposes only and are based on research conducted and presented solely by the author.  The information presented does not represent the views of the author only and does not constitute a complete description of any investment service.  In addition, nothing presented herein should be construed as investment advice, as an advertisement or offering of investment advisory services, or as an offer to sell or a solicitation to buy any security.  The data presented herein were obtained from various third-party sources.  While the data is believed to be reliable, no representation is made as to, and no responsibility, warranty or liability is accepted for the accuracy or completeness of such information.  International investments are subject to additional risks such as currency fluctuations, political instability and the potential for illiquid markets.  Past performance is no guarantee of future results.  There is risk of loss in all trading.  Back tested performance does not represent actual performance and should not be interpreted as an indication of such performance.  Also, back tested performance results have certain inherent limitations and differs from actual performance because it is achieved with the benefit of hindsight.