The chart in Figure 1 is not the “be all, end all” of overbought/oversold indicators. Likewise, given the unprecedented nature of the current situation, please understand that it is NOT intended to indicate a “buy” or “all clear” signal. It is simply intended to highlight the extremely oversold nature of the current market environment.
Please see also “Casino Collapse: The MGM Edition”
Ticker VXO
Ticker VXO is the “old” VIX Index, which measures the implied volatility of options on the S&P 100 Index (the “new” or current VIX Index uses options on the S&P 500 Index). When fear strikes, VXO “spikes” to sharply higher levels.
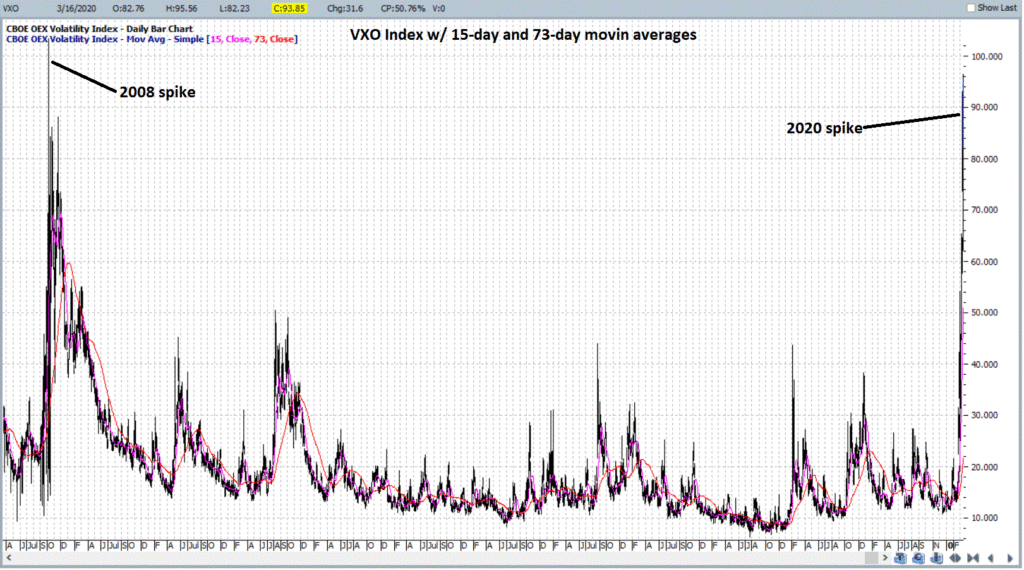
Figure 1 displays VXO with the 15-day and 73-day moving averages of daily readings. Note that when VXO “spikes” higher, the gap between the 15-day and 73-day averages widens significantly for a period of time. This gap often – although importantly, not always – accompanies “peak fear” for that move.

Figure 1 – VXO Index with 15-day and 73-day moving averages
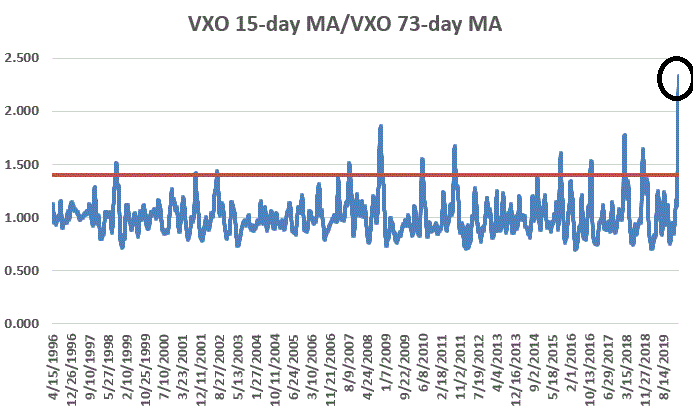
Because the 14-day average reacts more quickly than the 73-day average, one way to measure “peak fear” is by dividing the 15-day moving average by the 73-day moving average. See Figure 2.

Figure 2 – VXO 15-day MA divided by VXO 73-day MA
*Typically a reading over above 1.40 is a sign of an extremely oversold market
*As of 3/16/20, this VXO 15/73 ratio stood at a record high 2.333
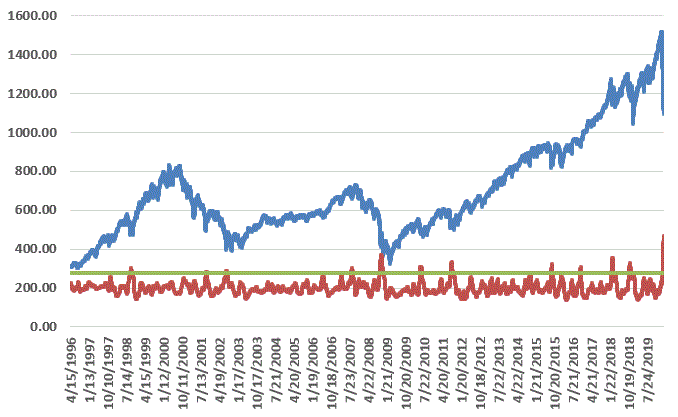
For perspective, Figure 3 displays:
*The S&P 100 Index (OEX) in blue
*The VXO 15/73 ratio (x 200 to make it more easily viewable) in red

Figure 3 – S&P 100 Index versus VXO 15/73 day MA ratio
What does it all mean? If history is a guide, it suggests that the worst of this particular downdraft has likely already occurred. Unfortunately, it DOES NOT mean that there cannot be further sizeable down moves nor that a massive new rally will unfold anytime soon.
What it does show is that fear is at an extremely elevated level. Typically, this can mark an opportunity for, a) skillful traders, and b) investors with a long-term horizon.
Here’s hoping.
Jay Kaeppel
Disclaimer: The information, opinions and ideas expressed herein are for informational and educational purposes only and are based on research conducted and presented solely by the author. The information presented does not represent the views of the author only and does not constitute a complete description of any investment service. In addition, nothing presented herein should be construed as investment advice, as an advertisement or offering of investment advisory services, or as an offer to sell or a solicitation to buy any security. The data presented herein were obtained from various third-party sources. While the data is believed to be reliable, no representation is made as to, and no responsibility, warranty or liability is accepted for the accuracy or completeness of such information. International investments are subject to additional risks such as currency fluctuations, political instability and the potential for illiquid markets. Past performance is no guarantee of future results. There is risk of loss in all trading. Back tested performance does not represent actual performance and should not be interpreted as an indication of such performance. Also, back tested performance results have certain inherent limitations and differs from actual performance because it is achieved with the benefit of hindsight.

