The recent panic in the financial markets witnessed a very unusual – though not unprecedented – phenomenon. U.S. treasury securities performed well while virtually all other forms of debt – municipal, corporate, mortgage-back, leveraged loan, etc. – got clobbered. This spasm reminds us that for all things there is a season.
One Approach to Risk-On/Risk-Off in Bonds
I detail several other caveats below but a couple things to mention at the outset. First off, I do not actively use the model I am about to present. Likewise, I am not telling you that you should use it. It is presented here as “food for thought”, based on the fact that using the strategy presented (hypothetically) has vastly outperformed buying and holding the securities involved. The securities used in the test are:
Long-Term U.S. Treasuries:
For indicator calculations we use monthly total return data for the Bloomberg Barclay’s Treasury Long Index. For trading result purposes, we use the Bloomberg Barclay’s Treasury Long Index from July 1980 through May 1986, then we use monthly total return data for ticker VUSTX (Vanguard Long-Term Treasury).
High Yield Corporate:
For indicator calculations we use monthly total return data for ticker VWEHX (Vanguard High-Yield Corporate Fund) starting in July 1980.
IMPORTANT: For actual real-world trading purposes these funds may not be viable choices as Vanguard imposes certain switching restrictions. An ETF-based alternative would be to use tickers TLT for treasuries and ticker HYG for high yield corporates.
The Calculations/Rules
A = 50-month cumulative % return for Bloomberg Barclays Treasury Long Index
B = 50-month cumulative % return for VWEHX
IF:
A < B then hold VUSTX for the next 7 months
A > B for 7 consecutive months then hold VWEHX
In actual English:
*If long-term treasuries have underperformed high-yield corporates over the previous 50-months, buy and hold long-term treasuries until they outperform high-yield corporate for 7 consecutive months – then sell long-term treasuries and buy high-yield corporates.
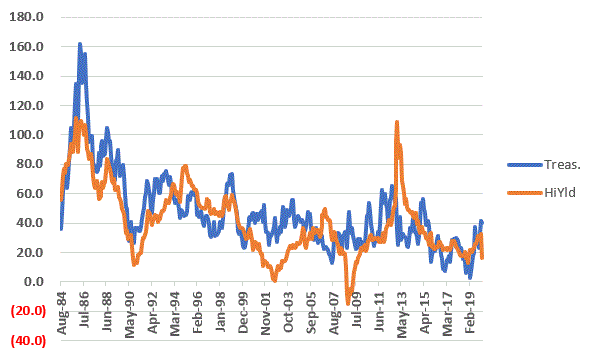
Figure 1 displays the 50-month cumulative % return for both long-term treasuries (blue line) and high-yield corporates (orange line). As you can see it goes back and forth.

Figure 1 – 50-month cumulative % total return for Long-Term treasuries (blue) and High-Yield corporate (orange)
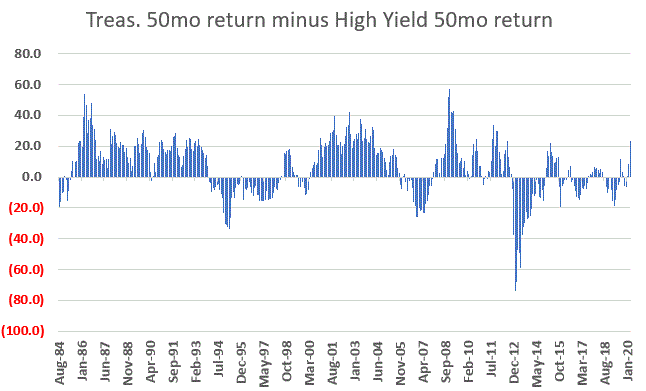
Figure 2 subtracts the orange line from Figure 1 from the blue line in Figure 1. When the result is positive it means long-term treasuries have outperformed and when it is negative it means high-yield corporates have outperformed.

Figure 2 – Long-term treasury 50-month cumulative % return minus High-yield corporate 50-month cumulative % return
So, when the value in Figure 2 is negative it means we will hold long-term treasuries for at least the next 7 months. And when the value in Figure 2 turns positive for 7 consecutive months it means we will sell long-term treasuries and hold high-yield corporates until the value in Figure 2 falls to negative once again.
IMPORTANT NOTE: The total return data source that I use reports results for the prior month early in the next month. In other words, I can’t make a calculation using January total return data on January 31st because January total return data does not get updated until early February. As a result, I follow this with a 1-month lag.
To spell it out: A trading decision at the end of February is based on data from the end of January. In other words, when the total return data for say January is updated in early February, we can do the “end of January” calculations and determine if a trade is to be made. If so, that trade gets made on the last trading day of February.
Results
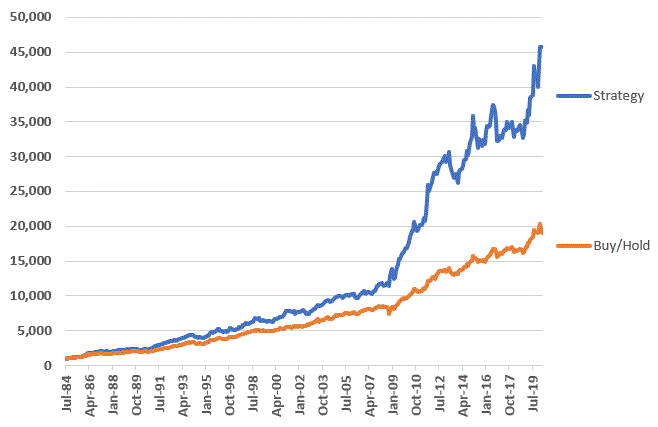
Figure 3 displays the growth of $1,000 invested using the Strategy versus buying-and-holding VUSTX and VWEHX, with an annual 50/50 rebalance at the end of December.

Figure 3 – Growth of $1,000 using Risk-On/Risk-Off Strategy (blue) versus Buy/Hold/Rebalance (orange); 1984-2020
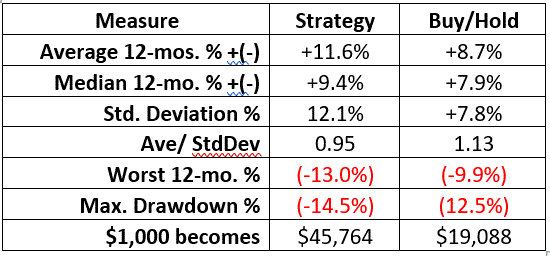
Figure 4 displays some relevant comparative performance data.

Figure 4 – Comparative Results
On the negative side, the Strategy does have a significantly higher standard deviation, a slightly higher maximum drawdown and a lower risk-adjusted return (Average 12mo. % divided by standard deviation).
On the plus side, the Strategy achieved a cumulative gain of +4,406% versus +1,809% for the buy/hold/rebalance approach (NOTE: March 2020 data is through 3/30 using price performance ONLY).
The Latest
The Strategy has been in long-term treasuries since the end of August 2018 and will continue to hold them through at least the end of August 2020. Since the end of August 2018 through 3/30/20 long-term treasuries have gained roughly +38% while high-yield corporates have lost about -4%.
Summary
So, is this the be all, end all of bond investing? Not likely. Given that interest rates have been in a downtrend since about 1981, it is fair to assume that at some point this trend will reverse. And when it does, it is more than fair to wonder how well long-term treasuries will perform.
But for now – and repeating – this Strategy is presented as food for thought and for further analysis by those so inclined, not as something that anyone should rush out and employ without some additional thought.
Disclaimer: The information, opinions and ideas expressed herein are for informational and educational purposes only and are based on research conducted and presented solely by the author. The information presented does not represent the views of the author only and does not constitute a complete description of any investment service. In addition, nothing presented herein should be construed as investment advice, as an advertisement or offering of investment advisory services, or as an offer to sell or a solicitation to buy any security. The data presented herein were obtained from various third-party sources. While the data is believed to be reliable, no representation is made as to, and no responsibility, warranty or liability is accepted for the accuracy or completeness of such information. International investments are subject to additional risks such as currency fluctuations, political instability and the potential for illiquid markets. Past performance is no guarantee of future results. There is risk of loss in all trading. Back tested performance does not represent actual performance and should not be interpreted as an indication of such performance. Also, back tested performance results have certain inherent limitations and differs from actual performance because it is achieved with the benefit of hindsight.


Awesome blog, thanks for the useful information.