I am not great with predictions, but I am 100% confident that the title of this piece will prove entirely accurate. Now how many of us will actually die from contracting Coronavirus remains to be seen. I am hoping it will be far less than we are being led to believe (Yes, I am a bit incensed about the fact that whatever the ultimate number ends up being, the media will do everything in their power to make it seem 1,000 times worse).
Like everyone else, I have to battle to keep emotions in check. And repeating what I said here, do whatever it is you think you need to do in terms of surviving what we are told is an “inevitable” pandemic. Stock up on food, water, supplies, masks, whatever.
When it comes to investing however….. I argued here and here that a bear market is likely between 12/31/2019 and 6/30/2022. In the here and now, things appear to be getting a bit overdone.
Getting to Oversold
I follow a version of the McClellan Oscillator using NASDAQ advances and declines instead of the NYSE. In simple terms, the MO measures the difference between the 19-day exponential average and the 39-day exponential average of daily advances minus declines. Extreme low readings indicate an “oversold” market – which can often be seen as a buying opportunity.
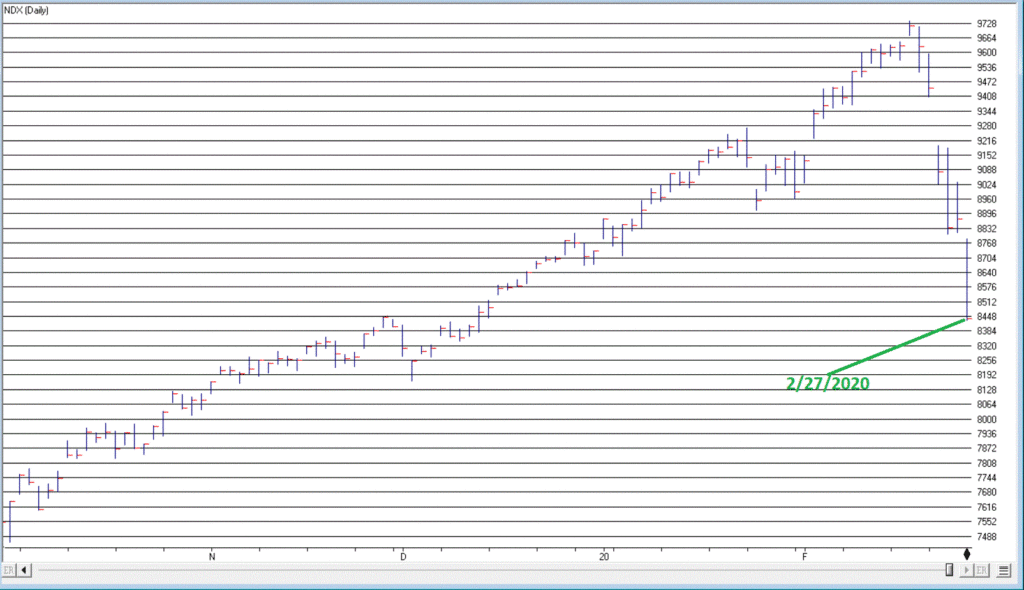
One extreme level that I look for is a daily MO reading of -300 or less. This level was pierced as of the close on 2/27/2020. Figure 1 displays the Nasdaq Composite Index since 1988 with the McClellan Oscillator below it. As you can see, readings below -300 are fairly rare.
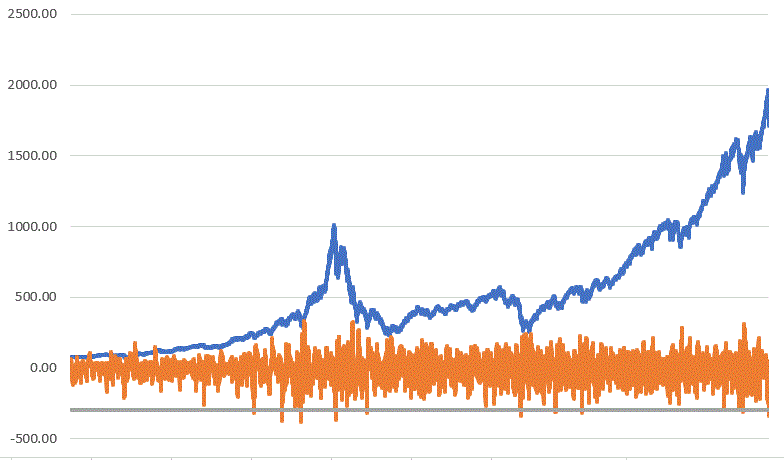
Figure 1 – Nasdaq Composite Index with Nasdaq McClellan Oscillator (1988-2020)
To get a better picture, Figure 2 displays the worst decline – using closing prices – experienced in the six months following each previous -300 MO reading. In other words, “How much worse did it get, after the first sign of an oversold situation?”
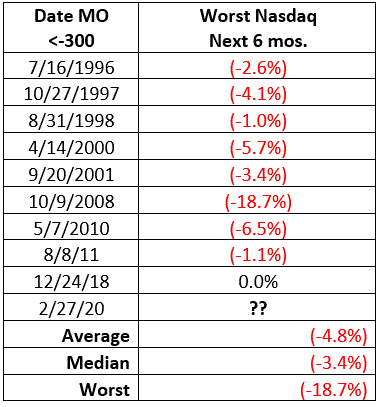
Figure 2 – Worst Nasdaq 100 declines in 6 months average McClellan Oscillator < -300
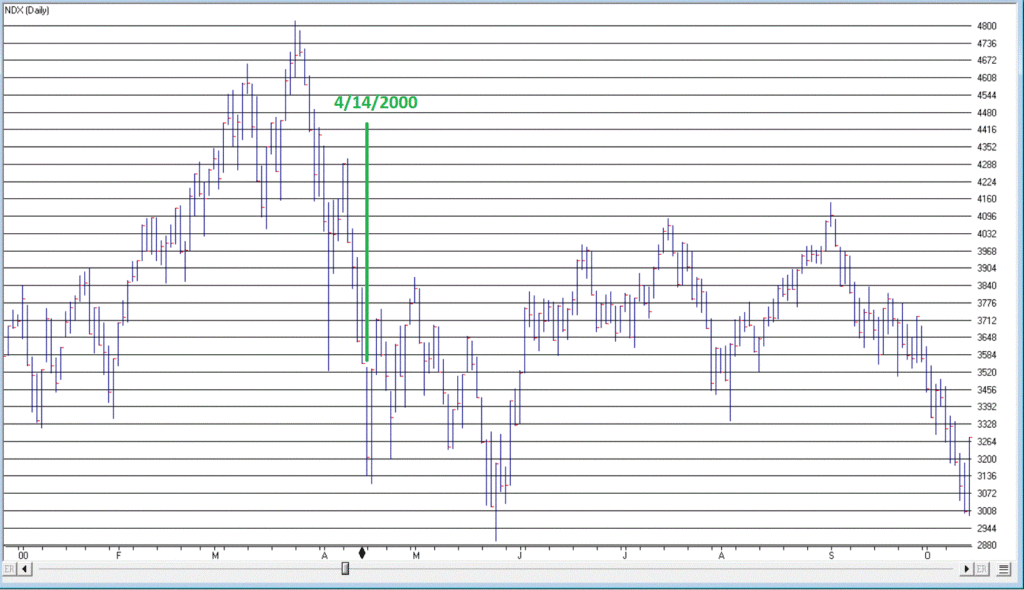
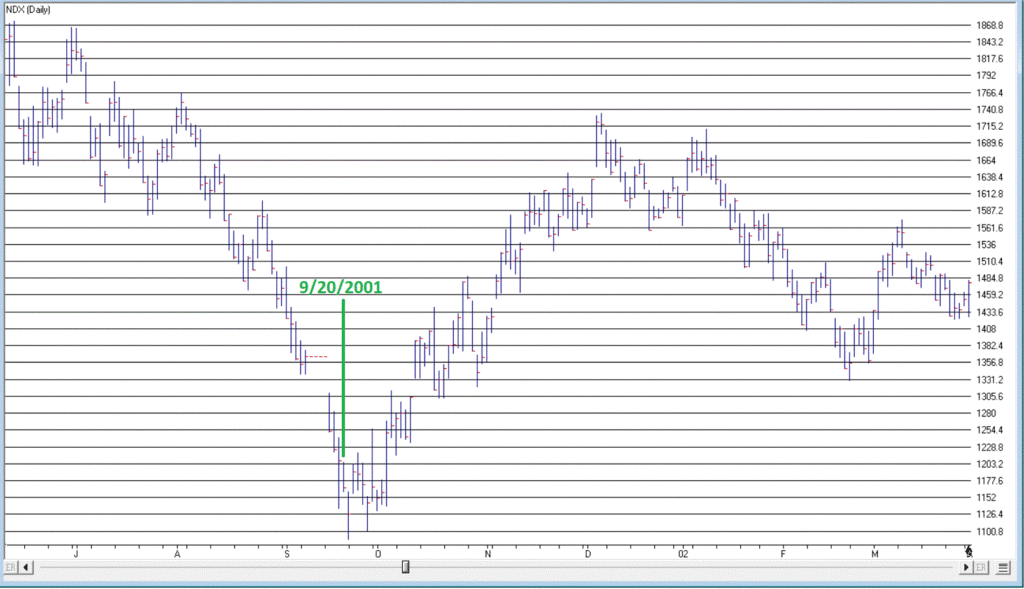
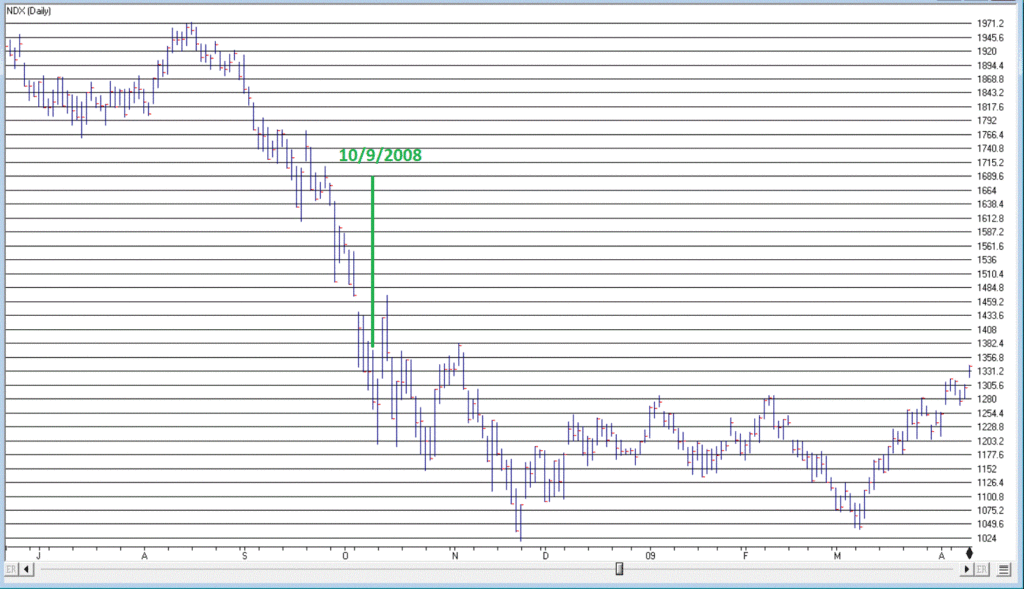
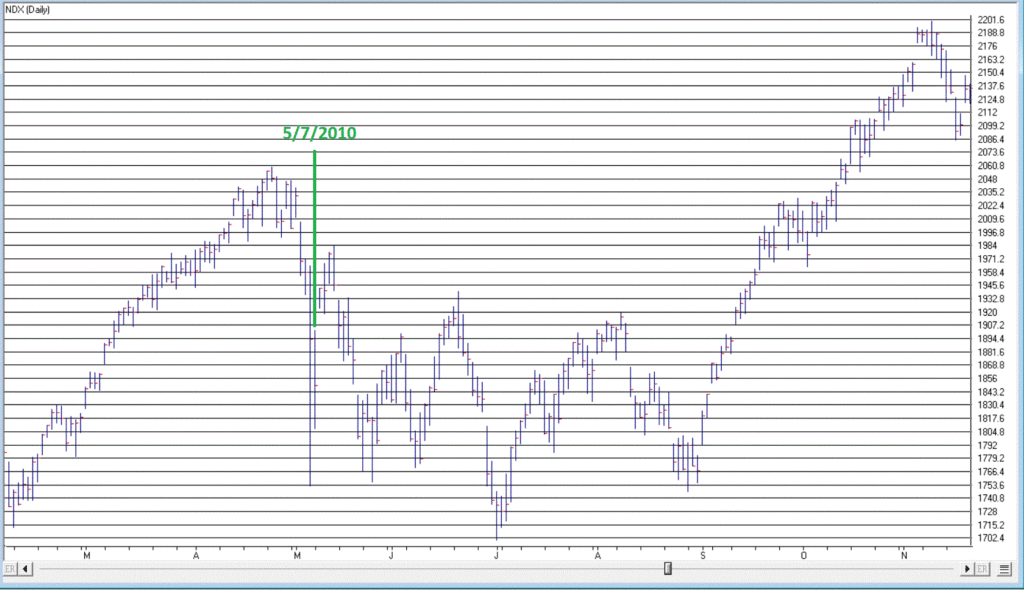
In 8 of the 9 cases, the maximum close to close decline from the first “oversold” reading was -6.5% or less. The exception of course was 2008, when the market plunged another 18+% before bottoming out.
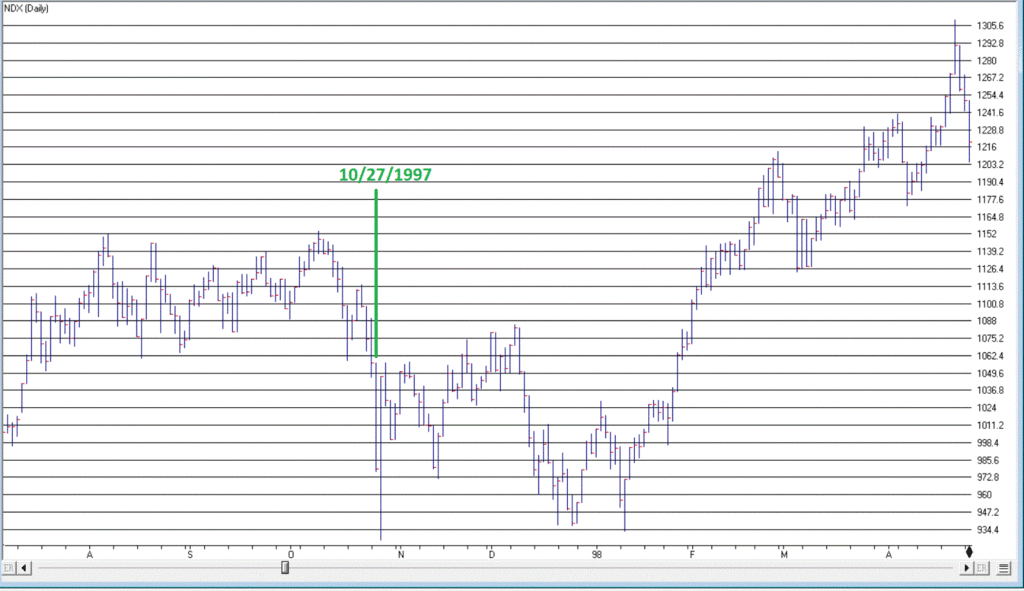
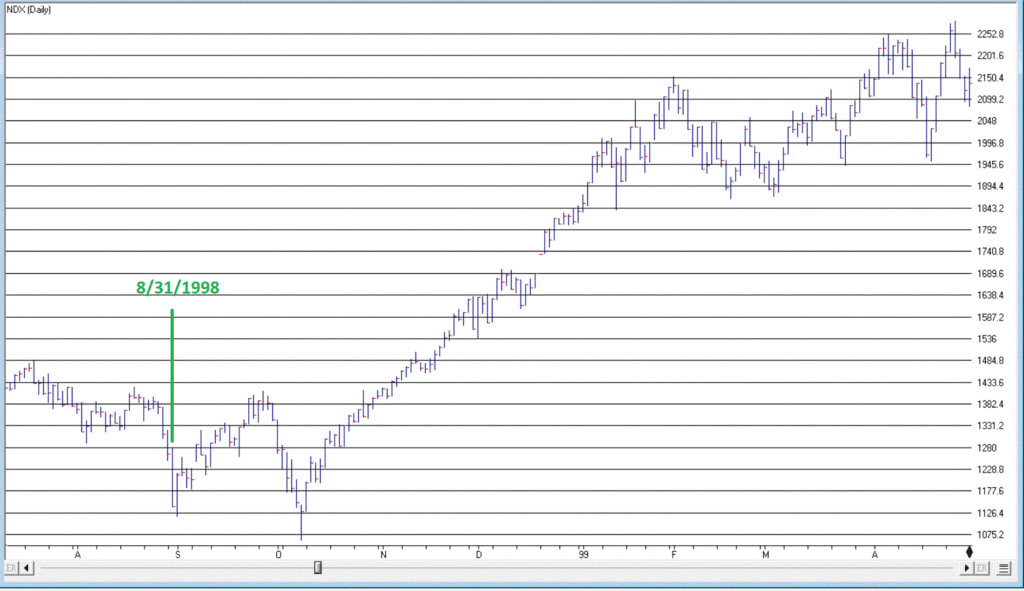
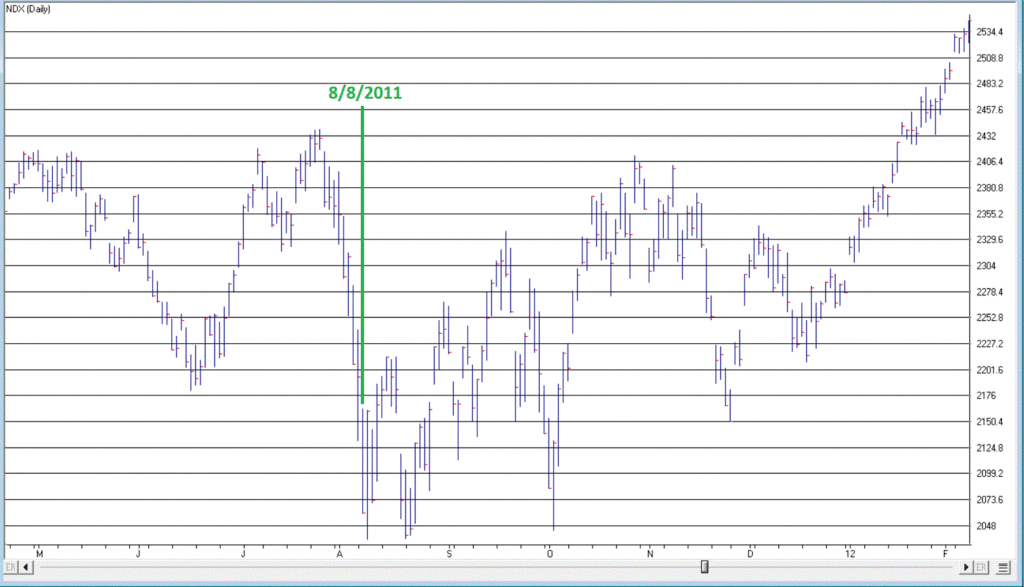
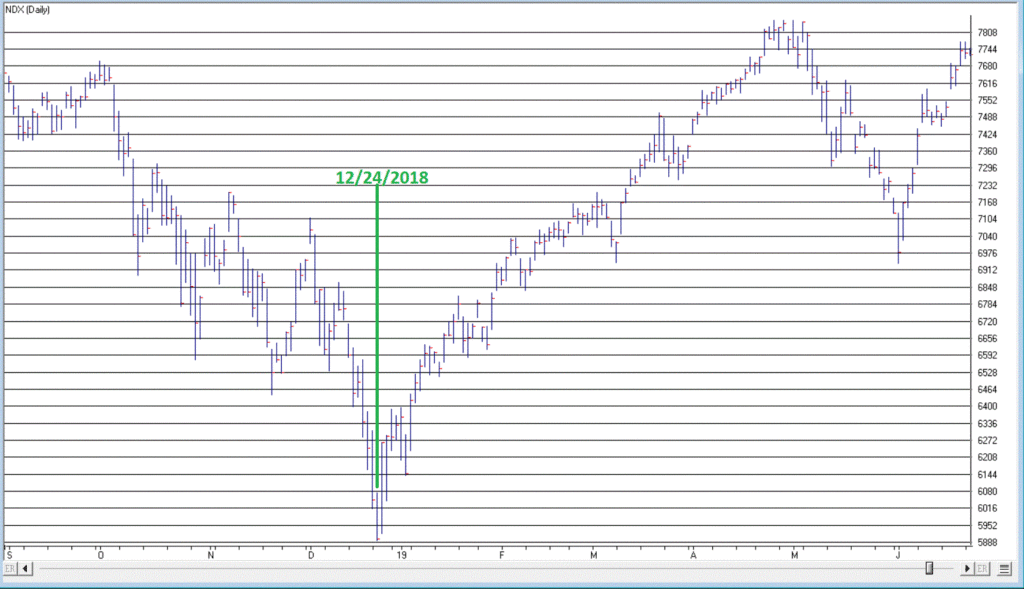
The charts that follow displays the Nasdaq 100 Index during the six months after the 1st MO -300 reading
Summary
Repeating from here:
*Keep your head screwed on straight
*Regarding pandemics and stock markets, adopt a “hope for the best, prepare for the worst mentality”
*If you believe you are overexposed in the market then make a plan for when and what and how much you should sell. Then follow your plan and DO NOT look back in regret
*If you want to put your head in the sand and just hold on forever, fight that urge (again I refer you to the articles linked above)
*If you have cash to invest – don’t try to be a hero, but don’t be a total wimp either
Jay Kaeppel
Disclaimer: The information, opinions and ideas expressed herein are for informational and educational purposes only and are based on research conducted and presented solely by the author. The information presented does not represent the views of the author only and does not constitute a complete description of any investment service. In addition, nothing presented herein should be construed as investment advice, as an advertisement or offering of investment advisory services, or as an offer to sell or a solicitation to buy any security. The data presented herein were obtained from various third-party sources. While the data is believed to be reliable, no representation is made as to, and no responsibility, warranty or liability is accepted for the accuracy or completeness of such information. International investments are subject to additional risks such as currency fluctuations, political instability and the potential for illiquid markets. Past performance is no guarantee of future results. There is risk of loss in all trading. Back tested performance does not represent actual performance and should not be interpreted as an indication of such performance. Also, back tested performance results have certain inherent limitations and differs from actual performance because it is achieved with the benefit of hindsight.


Jay, what are your thoughts on hedging to protect ones existing portfolio position? From the backtesting I’ve done a modest 20-25% allocation in SPXU, -3x leveraged short of the S&P 500 ETF, seems to provide protection yet still provides lower gains if the market ends up going higher. The money for the hedge can come from bonds, dry powder, or by selling 20-25% of the existing portfolio to use for the hedge.
If the market goes lower then one can start selling the SPXU allocation in stages and add to existing positions in ones portfolio or buy stocks that are more likely to rebound stronger. However if the market changes course and goes higher then one can do the same on the way up.
JD, There are lots of ways to hedge – inverse funds, put options, etc. It sounds to me like you have answered your own question. The main thing is to decide how big of a hedge you want to have, and then NEVER look back and kick yourself if, a) it wasn’t big enough, or b) it costs you profits. Again, it sounds like you already understand these concepts. Take Care, Jay
Thanks for the reply Jay, it’s appreciated. I’ve not hedged before so this is my first time using protection, did a 20% allocation (70% SPXU + 30% SQQQ). I’ve not used options before so it felt easier to go with inverse ETFs. Given the markets initial reaction to COVID-19 it seems protection is warranted.
Is there any guidelines as to when to exit a hedge or time frame when it’s likely not worthwhile to hold it? I know there’s no specific answer here, just looking for general recommendation. Example, exit if we exceed a certain % higher from the start of the decline or a specific % below the start of the decline. It’s one thing to understand the concept, yet another to execute on it. Die by fire I guess, forget COVID-19! lol
Jay, are you sure that 7/16/96 was a -300 date? The NDX was up 1.2% that day whereas the other dates were down days.
Tim, the index used in the calculations was the OTC Composite Index, not the Nasdaq 100. The OTC Composite was down on that date. Take Care, Jay
Thanks Jay, would this be the right chart to look at to determine the -300 level? https://stockcharts.com/h-sc/ui?s=$NAMOT
Yes