3,230.78
That’s the number that should be on investors minds today. Why? Simple. If the S&P 500 Index closes above that level today (it closed at 3,283,66 on Jan. 30th, so anything better than a daily decline of -52.88 SPX points will do the trick), the Stock Traders Almanac venerable “January Trifecta” will generate a bullish signal for the rest of 2020 (i.e., in theory the signal would be bullish for the stock market from the end of January 2020 through the end of December 2020).
The January Trifecta
Because STA is a paid service, and because I am a paying member, I would prefer not to explain all of the details of what comprises the January Trifecta. Instead I will focus simply on historical results.
The Measurements
For testing purposes, we will be excluding the month of January entirely from our results since any new signal begins at the end of January and any existing buy signal expires at the end of December.
So, we will look at results in two ways:
*S&P 500 price performance from the end of January through the end of December if the January Trifecta DOES give a bullish signal
*S&P 500 price performance from the end of January through the end of December if the January Trifecta DOES NOT give a bullish signal
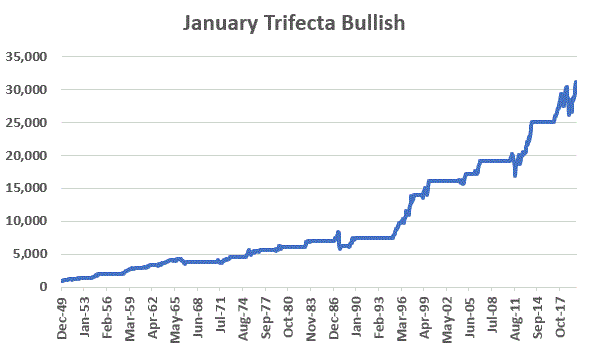
Figure 1 displays the price performance (growth of $1,000) for the S&P 500 Index for the months of February through December ONLY in those years when the January Trifecta was bullish.

Figure 1 – Growth of $1,000 in S&P (price only) Jan 31st through Dec 31st if STA January Trifecta IS BULLISH (1950-2019)
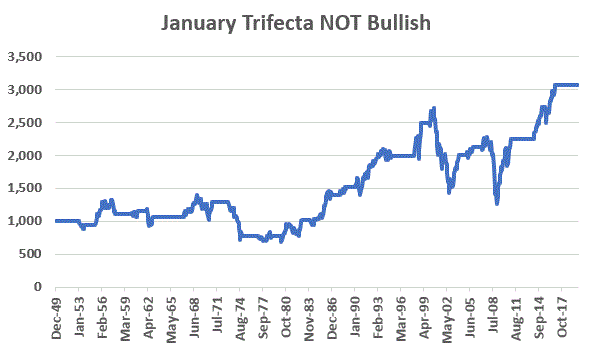
Figure 2 displays the price performance (growth of $1,000) for the S&P 500 Index for the months of February through December ONLY in those years when the January Trifecta was NOT bullish.

Figure 2 – Growth of $1,000 in S&P (price only) Jan 31st through Dec 31st if STA January Trifecta IS NOT BULLISH (1950-2019)
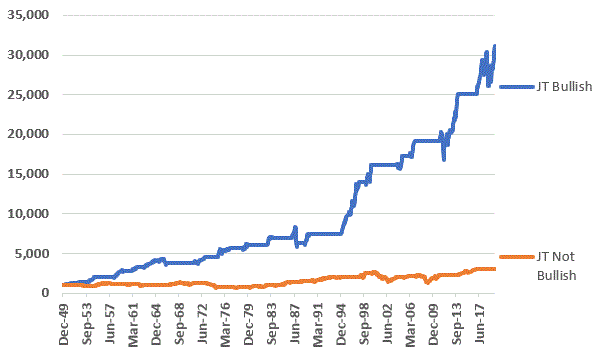
To better appreciate the implications, Figure 3 displays the two equity curves on the same chart.

Figure 3 – Comparison (1950-2019)
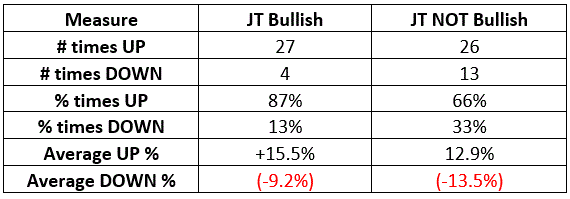
Figure 4 displays the relevant facts and figures.

Figure 4 – Comparison of bullish Jan. Trifecta years performance versus NOT bullish Jan. Trifecta years
Summary
Is the stock market “guaranteed” to rally between January 31, 2020 and December 31, 2020 if the S&P 500 Index closes above 3,320.78 on Jan. 31st?
No. An 87% historical win rate is NOT a 100% historical win rate.
But history suggests that giving the bullish case the benefit of the doubt would be the proper course of action.
Jay Kaeppel
Disclaimer: The information, opinions and ideas expressed herein are for informational and educational purposes only and are based on research conducted and presented solely by the author. The information presented does not represent the views of the author only and does not constitute a complete description of any investment service. In addition, nothing presented herein should be construed as investment advice, as an advertisement or offering of investment advisory services, or as an offer to sell or a solicitation to buy any security. The data presented herein were obtained from various third-party sources. While the data is believed to be reliable, no representation is made as to, and no responsibility, warranty or liability is accepted for the accuracy or completeness of such information. International investments are subject to additional risks such as currency fluctuations, political instability and the potential for illiquid markets. Past performance is no guarantee of future results. There is risk of loss in all trading. Back tested performance does not represent actual performance and should not be interpreted as an indication of such performance. Also, back tested performance results have certain inherent limitations and differs from actual performance because it is achieved with the benefit of hindsight.


SPX closed at 3225.52. What next?
Pat, Life goes on(?). Jay