The 60% stock/40% bond model portfolio has been a popular (not to mention “simple”) investment approach for investors for many years. But with the stock market at a high level of valuation (Shiller P/E, price-to-sales, etc.) it is fair to raise the question of how much upside exists in the years immediately ahead. Likewise, with interest rates so low it is fair to question the potential for meaningful returns from bonds in the years ahead.
So, let’s consider an alternative to the traditional 60/40 approach that seeks to take advantage of the seasonal/cyclical nature of the stock and bond markets.
The Test
Our test will run from Dec 31, 1978 through Dec 31, 2019
As a baseline, our Standard 60/40 Strategy will operate as follows:
*On Jan 1 60% goes into the S&P 500 Index
*On Jan 1 40% goes into the Bloomberg Barclays Aggregate Bond Index
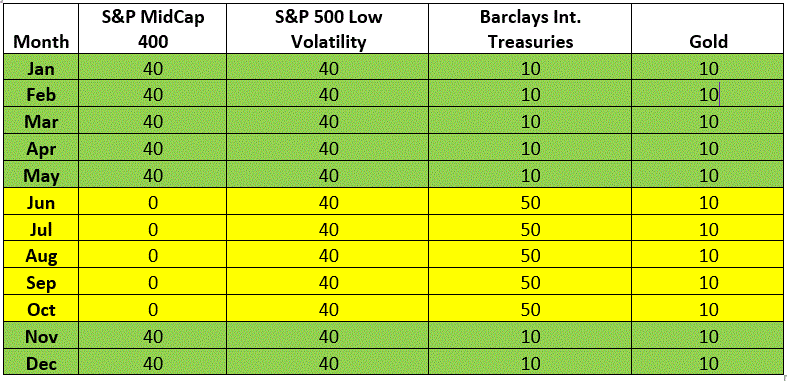
Our Modified 60/40 Strategy will operate as follows:
On November 1:
*40% goes into the S&P Midcap 400 Index
*40% goes into the S&P 500 Low Volatility Index
*10% goes into the Bloomberg Barclays Intermediate Treasury Index
*10% goes into Gold
On June 1:
*40% goes into the S&P 500 Low Volatility Index
*50% goes into the Bloomberg Barclays Intermediate Treasury Index
*10% goes into Gold
In other words:
*The Modified Strategy always holds 40% in the S&P 500 Low Volatility Index and 10% in Gold
*The Modified Strategy holds 40% in Midcap stocks and 10% in intermediate treasuries from November through May and holds 50% in intermediate-term treasuries (and 0% in MidCap stocks) from June through October
*To achieve this, on Nov. 1 we move 40% of the portfolio out of intermediate term treasuries and into Midcap stocks. On Jun. 1 we exit Midcap stocks completely and move that money into intermediate-term treasuries. So two trades/rebalances a year instead of one as with the Standard 60/40.

Table 1 – Modified 60/40 Strategy Investment Calendar
For the test we use monthly total return data for the indexes listed above.
The Results
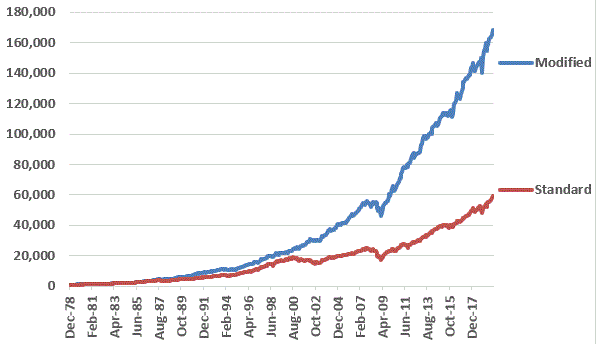
Figure 1 displays the growth of $1,000 invested in both the Modified Strategy and Standard Strategy.

Figure 1 – Growth of $1,000 invested in each strategy; 1979-2019
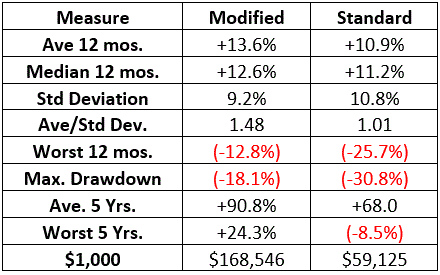
Figure 2 displays some relevant facts and figures

Figure 2 – Comparative Results; 1979-2019
Figure 3 below displays the year-by-year results for both strategies. A few key things to note
*The Modified Strategy was UP 38 out of 41 years with the worst year being 2008 with a loss of -6.1%
*The Standard Strategy was up 34 out of 41 years with the worst year being 2008 with a loss of -20.1%
*It should also be noted that the Modified Strategy showed a gain in the bear market years of 2000, 2001 and 2002 (the Standard Strategy was down modestly in each of those years).
| Modified | Standard | |
| 1979 | 23.7 | 11.9 |
| 1980 | 9.0 | 20.6 |
| 1981 | 9.4 | (0.4) |
| 1982 | 20.9 | 26.0 |
| 1983 | 19.1 | 16.9 |
| 1984 | 6.6 | 9.8 |
| 1985 | 30.1 | 27.9 |
| 1986 | 23.3 | 17.3 |
| 1987 | 14.4 | 4.3 |
| 1988 | 16.9 | 13.1 |
| 1989 | 30.9 | 24.8 |
| 1990 | 13.5 | 1.7 |
| 1991 | 28.0 | 24.7 |
| 1992 | 9.1 | 7.5 |
| 1993 | 11.7 | 9.9 |
| 1994 | (4.1) | (0.4) |
| 1995 | 25.0 | 29.9 |
| 1996 | 15.7 | 15.2 |
| 1997 | 18.7 | 23.9 |
| 1998 | 17.4 | 20.6 |
| 1999 | 2.9 | 12.3 |
| 2000 | 15.3 | (0.8) |
| 2001 | 11.9 | (3.8) |
| 2002 | 5.4 | (9.2) |
| 2003 | 17.5 | 18.9 |
| 2004 | 14.8 | 8.3 |
| 2005 | 5.5 | 3.9 |
| 2006 | 15.2 | 11.2 |
| 2007 | 9.5 | 6.1 |
| 2008 | (6.1) | (20.1) |
| 2009 | 18.6 | 18.3 |
| 2010 | 17.1 | 11.7 |
| 2011 | 13.2 | 4.4 |
| 2012 | 9.5 | 11.3 |
| 2013 | 14.8 | 18.6 |
| 2014 | 9.6 | 10.6 |
| 2015 | 2.0 | 1.1 |
| 2016 | 12.9 | 8.2 |
| 2017 | 11.6 | 14.5 |
| 2018 | (2.1) | (2.6) |
| 2019 | 20.3 | 22.4 |
Figure 3 – Year-by-Year Results
Summary
The Modified 60/40 seeks to take advantage of the historical tendency for the stock market in general (and midcap stocks in particular) to perform better during the Nov-May period that during the Jun-Oct period. Historically speaking, the results appear favorably. As always, I am not “recommending” the Modified 60/40 Strategy, just pointing out the comparative results of a hypothetical test.
So, is the “Modified 60/40” better than the “Standard 60/40”? And is the “Modified 60/40” sure to outperform the “Standard 60/40” in the years ahead? The answer to both of these questions (sadly) is “not necessarily”.
Still, it is important to consider the possibility that simple modifications to a simple strategy may allow an investor to outperform the masses.
Jay Kaeppel
Disclaimer: The information, opinions and ideas expressed herein are for informational and educational purposes only and are based on research conducted and presented solely by the author. The information presented does not represent the views of the author only and does not constitute a complete description of any investment service. In addition, nothing presented herein should be construed as investment advice, as an advertisement or offering of investment advisory services, or as an offer to sell or a solicitation to buy any security. The data presented herein were obtained from various third-party sources. While the data is believed to be reliable, no representation is made as to, and no responsibility, warranty or liability is accepted for the accuracy or completeness of such information. International investments are subject to additional risks such as currency fluctuations, political instability and the potential for illiquid markets. Past performance is no guarantee of future results. There is risk of loss in all trading. Back tested performance does not represent actual performance and should not be interpreted as an indication of such performance. Also, back tested performance results have certain inherent limitations and differs from actual performance because it is achieved with the benefit of hindsight.


Are these results adjusted for dividends?
Satish, yes the test used monthly total return data. Jay
Would one use SPLV or USMV to match the low volatility stock portion of the “system”?
Paul, SPLV tracks the S&P 500 Low Volatility Index, which is the index I used in the test. USMV tracks the MSCI USA Minimum Volatility Index. Jay