Everything in investing is a tradeoff. Are stocks a better investment right now than bonds? Large-cap or small-cap? Growth versus Value? U.S. versus International? Making things more difficult is the fact that the relationships are forever changing. The key then is identifying the trend “right now” and trying to ride it as long as possible. What follows is a very long-term approach to determining whether to favor stocks or bonds based on the stock market earnings yield and the 10-year treasury yield.
The Data
A= Earnings Yield
For the “earnings yield” we divide 100 by the monthly value for the Shiller P/E Ratio (https://www.multpl.com/shiller-pe). The higher the p/e ratio rises the lower the earnings yield and vice versa.
B= 10-Year Treasury Yield
For the 10-Year Yield we will use data downloaded from MacroTrends.net (https://www.macrotrends.net/2016/10-year-treasury-bond-rate-yield-chart)
C = (A – B)
At the end of each month we subtract the 10-year treasury yield from the Shiller earnings yield to get our Indicator value.
Deciding Where to Invest
*If the value for Indicator C 5 months ago was > 1.00 then FAVOR STOCKS
*If the value for Indicator C 5 months ago was <= 1.00 then FAVOR BONDS
So at the end of December we look at the value for Indicator C at the end of the previous July (i.e., 5 months ago) to see if it is above or below 1.00.
The 5-month lag is a nod to the fact that it takes a while for investors to recognize a change in the relative favorability of stocks versus bonds. In Figure 1 the blue line represents the earnings yield and the orange line represents the 10-year treasury yield.

Figure 1 – Shiller earnings yield (blue) and 10-year treasury yield (orange) 1962-present
Figure 2 displays the difference between the two values with the 1.00 cutoff level.
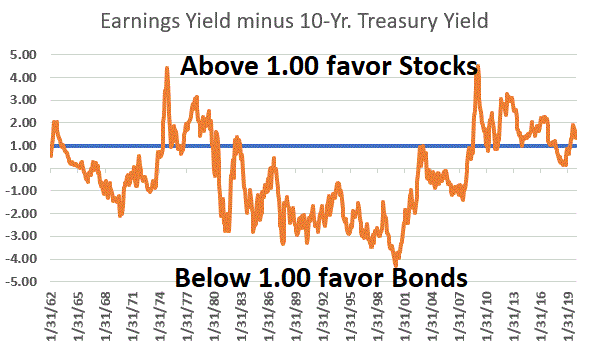
Figure 2 – Shiller earnings yield minus 10-year treasury yield; 1962-present
When the orange line in Figure 2 is above the blue line it favors stocks and when it is below the blue line it favors bonds.
Use the Model as a Strategy Guide
For the record, I am not actually touting this as a “trading model”, but rather as more of a way to determine whether to “lean stocks” or to “lean bonds.” But just to close the loop let’s look at some hypothetical performance numbers.
If the model favors STOCKS: We will hold the S&P 500 Index*
If the model favors BONDS: We will hold the Bloomberg Barclays Long Treasury Index*
*Using monthly total return data from the PEP Database by Callan Associates
(NOTE: While the model uses intermediate-term treasuries to generate signals, for trading purposes we will focus on long-term treasuries. Our database for both starts in January of 1973)
Figure 3 displays the cumulative growth of $1,000 invested using our “Earnings Yield Strategy” versus the cumulative for buying and holding the S&P 500 Index and buying and holding the Bloomberg Barclays Long Treasury Index.
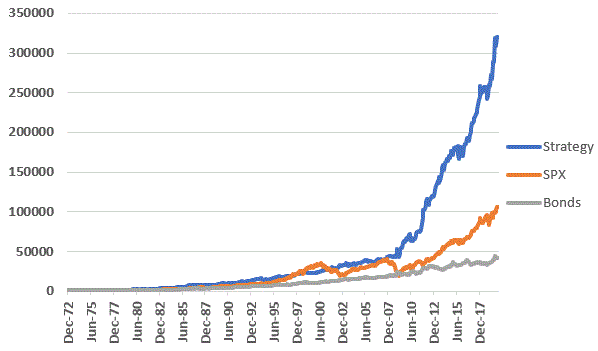
Figure 3 – Growth of $1,000 using Earnings Yield Strategy versus buying-and-holding S&P 500 Index (1973-present)
Figure 4 displays some relevant facts and figures.
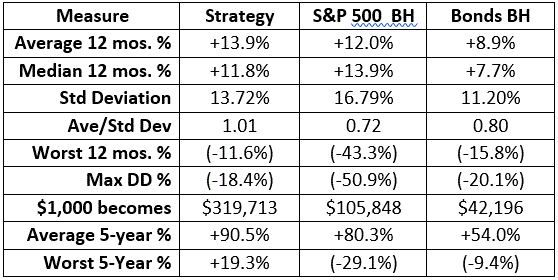
Figure 4 – Comparative Figures: Earnings Yield Strategy versus Buy-and-Hold for stocks and bonds (1973-2019)
Key things to note:
*Strategy worst 12 months = -11.6% versus in -43.3% for SPX
*Strategy Max Drawdown = -18.4% versus in -50.9% for SPX
*Strategy – 100% of all 5-year rolling periods have been positive
A Note Regarding Consistency
A few more notes regarding this method. Once again, I am not necessarily advocating this as a trading strategy per se. Also, if someone were using it to invest, when the day eventually comes that long-term treasury yields actually start to rise, a move from long-term bonds to intermediate-term bonds would likely be wise.
For now, let’s highlight one last thing regarding consistency. Figure 5 displays cumulative growth for the S&P 500 Index ONLY during those times when the Earnings Yield Strategy favors stocks.
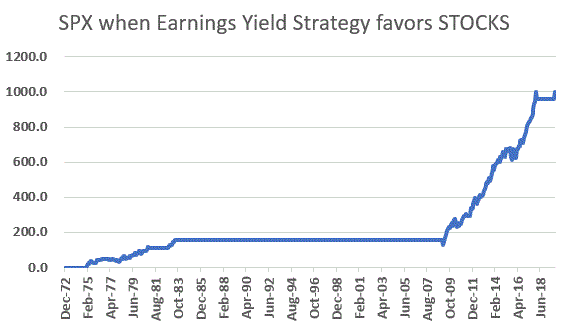
Figure 5 – S&P 500 Index cumulative % gain ONLY when Earnings Yield Strategy favors Stocks; 1973-2019
Figure 6 displays the cumulative growth for the Bloomberg Barclays Long Treasury Index ONLY during those times when the Earnings Yield Strategy favors bonds.
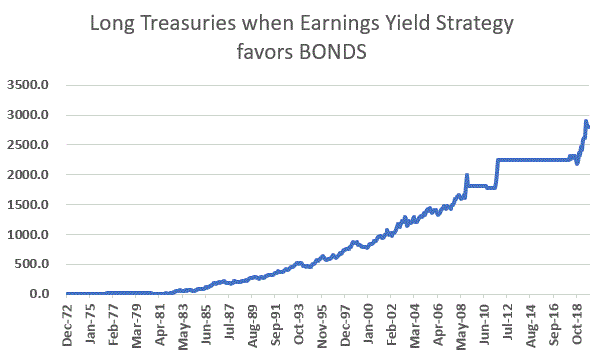
Figure 6 – Bloomberg Barclays Long Treasury Index cumulative % gain ONLY when Earnings Yield Strategy favors Bonds; 1973-2019
In terms of “avoiding trouble”, Figures 5 and 6 suggest that the Earnings Yield Strategy does a pretty good job of it.
Jay Kaeppel
Disclaimer: The information, opinions and ideas expressed herein are for informational and educational purposes only and are based on research conducted and presented solely by the author. The information presented does not represent the views of the author only and does not constitute a complete description of any investment service. In addition, nothing presented herein should be construed as investment advice, as an advertisement or offering of investment advisory services, or as an offer to sell or a solicitation to buy any security. The data presented herein were obtained from various third-party sources. While the data is believed to be reliable, no representation is made as to, and no responsibility, warranty or liability is accepted for the accuracy or completeness of such information. International investments are subject to additional risks such as currency fluctuations, political instability and the potential for illiquid markets. Past performance is no guarantee of future results. There is risk of loss in all trading. Back tested performance does not represent actual performance and should not be interpreted as an indication of such performance. Also, back tested performance results have certain inherent limitations and differs from actual performance because it is achieved with the benefit of hindsight.

