Crude oil has been moving higher of late. After bottoming in the low $40’s at the end of 2018, spot crude is now over $60 a barrel. Can this continue? One measure say’s “possibly yes”.
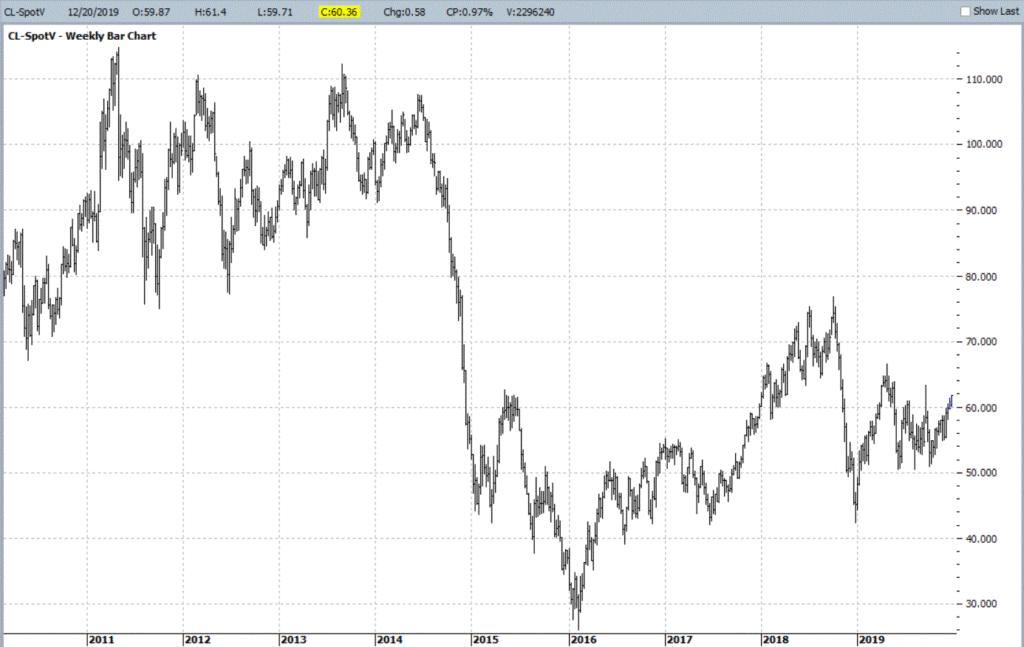
Figure 1 – Spot Crude Oil (Courtesy ProfitSource by HUBB)
The Gold/Crude Connection
Figure 2 displays the ratio of (the price of a barrel of) crude oil divided by (the price for an ounce of) gold. As you can see in the lower right of Figure 2, the ratio recently bounced of a relatively low reading – i.e., crude became very undervalued relative to gold. Does this matter? Let’s take a closer look.
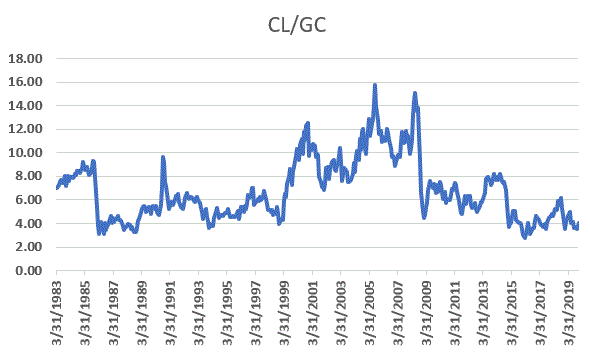
Figure 2 – Spot Crude Oil / Spot Gold ratio (Data Courtesy of ProfitSource by HUBB)
One way to quantify “extremes” is as follows:
*Take the 36-month average of the CL/GC ratio
*Create Bollinger Bands above and below the 36-month average using standard deviation * 1.25
See Figure 3
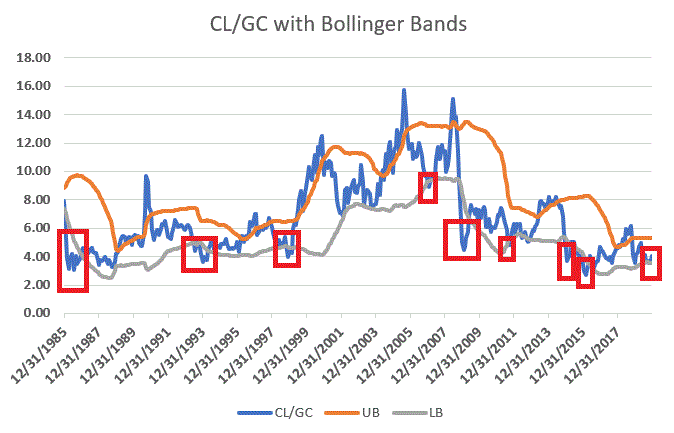
Figure 3 – Spot Crude Oil / Spot Gold ratio with 1.25x Bollinger Bands (above and below 36-month moving average; moving average not shown)
What we are looking for is:
*Times when the ratio dropped BELOW the Lower Band and then
*The distance between the ratio and the Lower Band narrows for one month
The most recent “buy signal” triggered at the end of November 2019. Figure 4 displays the percentage gain/loss for crude oil following the 1st “buy signal” in 12 months (i.e., overlapping signals are omitted) since 1984.
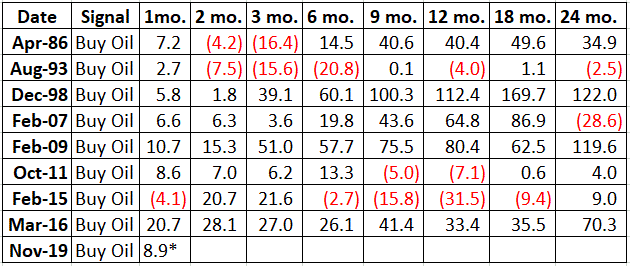
Figure 4 – Spot crude oil % profit/loss performance following previous “CL/GC Ratio” buy signals (1st signal in latest 12 months)
Figure 5 displays a summary of crude oil performance following the dates shown in Figure 4.

Figure 5 – Summary of Crude Oil performance following previous “CL/GC Ratio” buy signals
For the record, the “sweet spot” appears to be 18 months after a new signal. As you can see in Figures 4 and 5, 7 of the previous 8 signals (87.5%) saw crude oil higher 18 months later, with an median gain of +42.6% . Nevertheless, it needs to be pointed out that a whole lot of downside volatility can happen along the way.
Figure 6 displays the previous signals on a chart of spot crude oil.
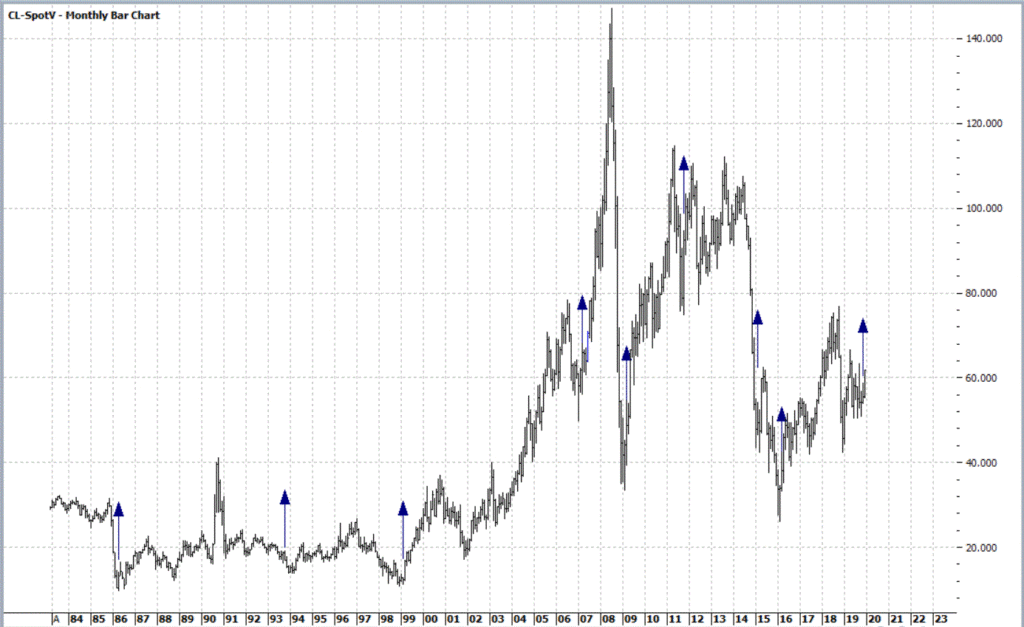
Figure 6 – Previous CL/GC Ratio Buy Signals (Courtesy ProfitSource by HUBB)
Summary
As you can see in Figures 4 through 6, previous signals from the Crude/Gold Ratio have witnessed some big subsequent moves in the price of crude oil. However, do NOT make the mistake of thinking that crude is sure to move higher in the months ahead. There are many factors that impact the price of arguably the world’s most important commodity. Likewise, crude has had a very good run since the buy signal at the end of November and may be a bit overextended to the upside. In the short-term it may be due for a pullback.
But speculators willing to assume the risks might keep an eye open for the next pullback in the price of crude as the long side of crude oil may be the place to be.
Jay Kaeppel
Disclaimer: The information, opinions and ideas expressed herein are for informational and educational purposes only and are based on research conducted and presented solely by the author. The information presented does not represent the views of the author only and does not constitute a complete description of any investment service. In addition, nothing presented herein should be construed as investment advice, as an advertisement or offering of investment advisory services, or as an offer to sell or a solicitation to buy any security. The data presented herein were obtained from various third-party sources. While the data is believed to be reliable, no representation is made as to, and no responsibility, warranty or liability is accepted for the accuracy or completeness of such information. International investments are subject to additional risks such as currency fluctuations, political instability and the potential for illiquid markets. Past performance is no guarantee of future results. There is risk of loss in all trading. Back tested performance does not represent actual performance and should not be interpreted as an indication of such performance. Also, back tested performance results have certain inherent limitations and differs from actual performance because it is achieved with the benefit of hindsight.


the other option is gold is over valued and falls.