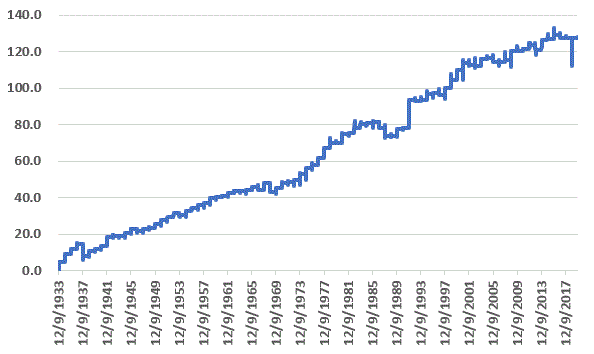
It’s the Holiday Season and people are busy so let’s keep this one short. Figure 1 displays the cumulative % gain/loss achieved by holding the Dow Jones Industrial Average ONLY during the last 7 trading days of each year starting in 1933.

Figure 1 – Cumulative Dow % price +/- during last 7 trading days of year ONLY; 1933-2019
The long-term trend is fairly obvious. For the record, Figure 2 displays some relevant facts and figures.
| Measure | Result |
| # times UP | 67 |
| # time DOWN | 19 |
| % times UP | 78% |
| % times DOWN | 22% |
| Average UP | +1.56% |
| Average DOWN | (-1.11%) |
| % of 10-Yrs. UP | 100% |
| % of 10-Yrs. DOWN | 0% |
Figure 2 – Relevant Facts and Figures
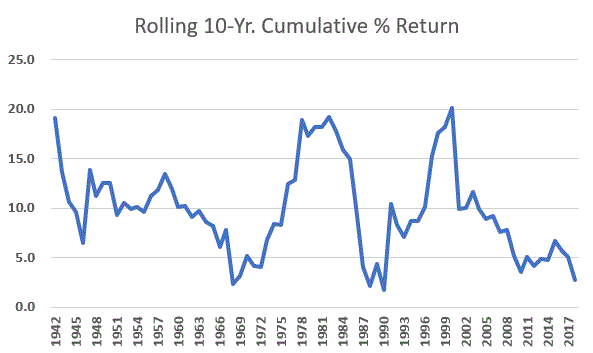
Last year of course was a harrowing ride as the market plunged into Christmas Eve and then reversed sharply the next trading day. Also note that 78% winning trades is a far cry from 100% winning trades. Nevertheless, it is also important to note that that every rolling 10-year period has showed a gain (77 and oh is the score to date). Figure 3 displays the rolling 10-year return.

Figure 3 – Rolling 10-year Cumulative Dow % price return (last 7 days of trading year ONLY); 1942-2019
Note that the latest 10-years ranks near the bottom of all 10-year rolling periods. This tells us one of two things. Either:
*This little “quirk” of the market perhaps just doesn’t work anymore like it used to, OR;
*Things will improve dramatically in the years ahead
Not making any predictions, but anything that generates consistently positive results over 80+ years get the benefit of the doubt in my book.
Jay Kaeppel
Disclaimer: The information, opinions and ideas expressed herein are for informational and educational purposes only and are based on research conducted and presented solely by the author. The information presented does not represent the views of the author only and does not constitute a complete description of any investment service. In addition, nothing presented herein should be construed as investment advice, as an advertisement or offering of investment advisory services, or as an offer to sell or a solicitation to buy any security. The data presented herein were obtained from various third-party sources. While the data is believed to be reliable, no representation is made as to, and no responsibility, warranty or liability is accepted for the accuracy or completeness of such information. International investments are subject to additional risks such as currency fluctuations, political instability and the potential for illiquid markets. Past performance is no guarantee of future results. There is risk of loss in all trading. Back tested performance does not represent actual performance and should not be interpreted as an indication of such performance. Also, back tested performance results have certain inherent limitations and differs from actual performance because it is achieved with the benefit of hindsight.


Impressive returns. Instead of Dow Jones, I think you may have done even better with small caps- something like IWM.