Foreign currencies are rarely top of mind for the average investor. This is not entirely surprising given some of the complexities involved. In all candor, currency conversions still kind of make my head spin at times.
Still, it is interesting to note that while the stock market trades roughly $200 billion dollars per day, the FOREX market trades roughly $5 trillion dollars per day (data source: www.dailyfx.com). So, there must be something going on there.
In any event, this article is not intended to get you excited or interested in FOREX trading. We are going to go much narrower in our focus.
The Euro End-of-Year Seasonal Tendency
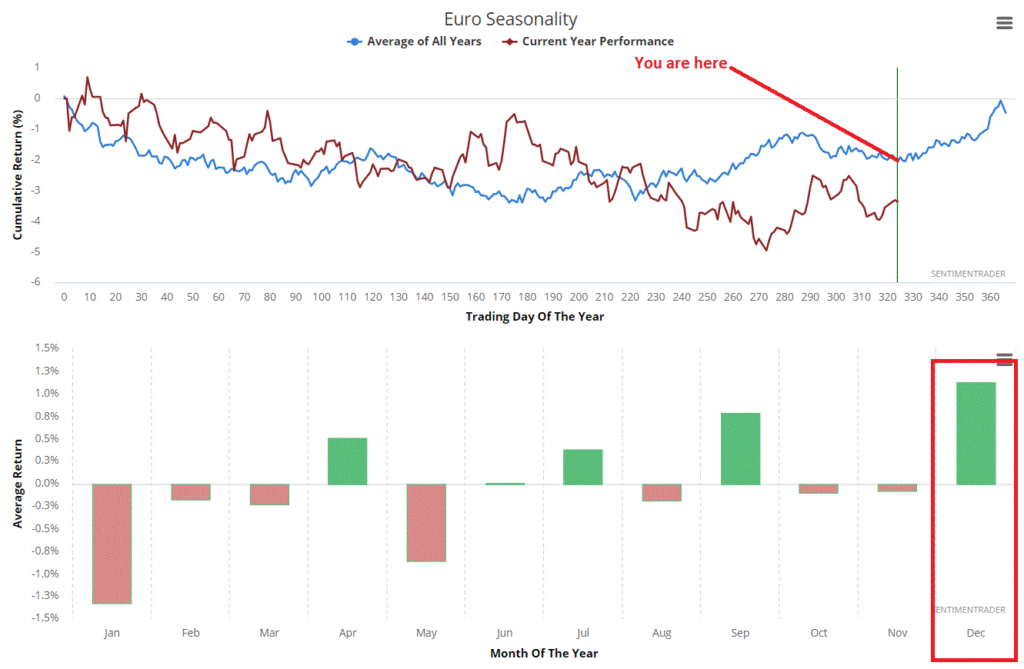
Figure 1 displays the annual seasonal trend for the Euro according to www.sentimentrader.com.

Figure 1 – Euro Annual Seasonal Trend (Courtesy Sentimentrader.com)
It is critical to understand that this is the “average” for what has happened in the past and should in no way be viewed as a “roadmap”. Still, the point is pretty clear – if history proves and accurate guide this time around then the Euro may perform well between now and the end of the year.
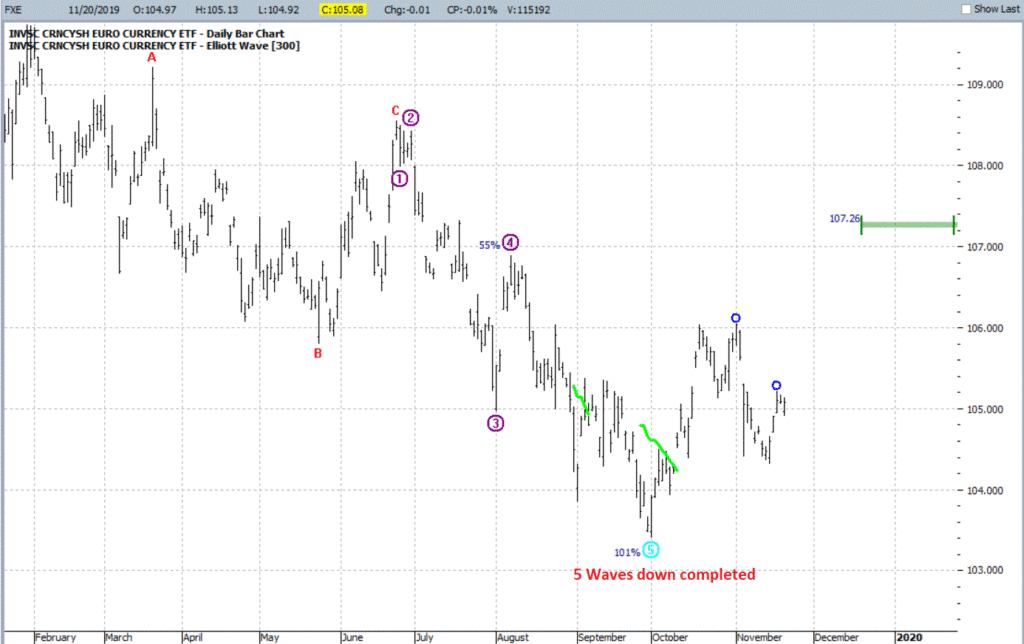
Figure 2 displays the ETF ticker FXE (which tracks the Euro) with a completed 5 waves down Elliott Wave count (and a potential price target generated using the Range Projection tool from www.ProfitSource.com).

Figure 2 – FXE with Elliott Wave and Price Projection Tool (Courtesy ProfitSource by HUBB)
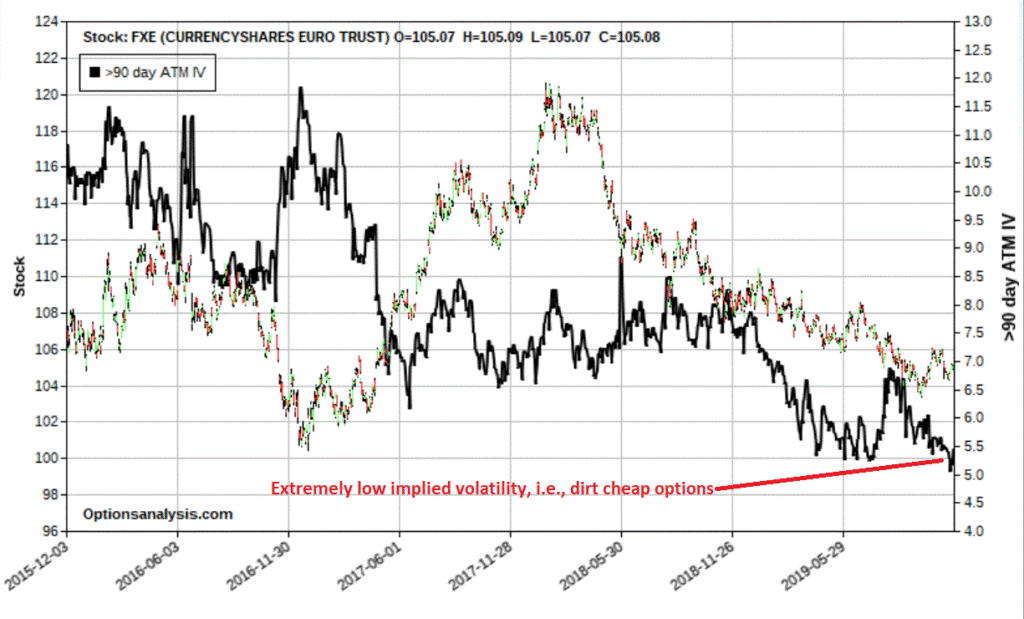
Finally, Figure 3 tells us that options on ticker FXE are presently dirt cheap – i.e., implied option volatility (the black line in Figure 3) is extremely low. This tells us that little option premium is built into the prices of FXE options.

Figure 3 – FXE with implied volatility(Courtesy www.OptionsAnalysis.com)
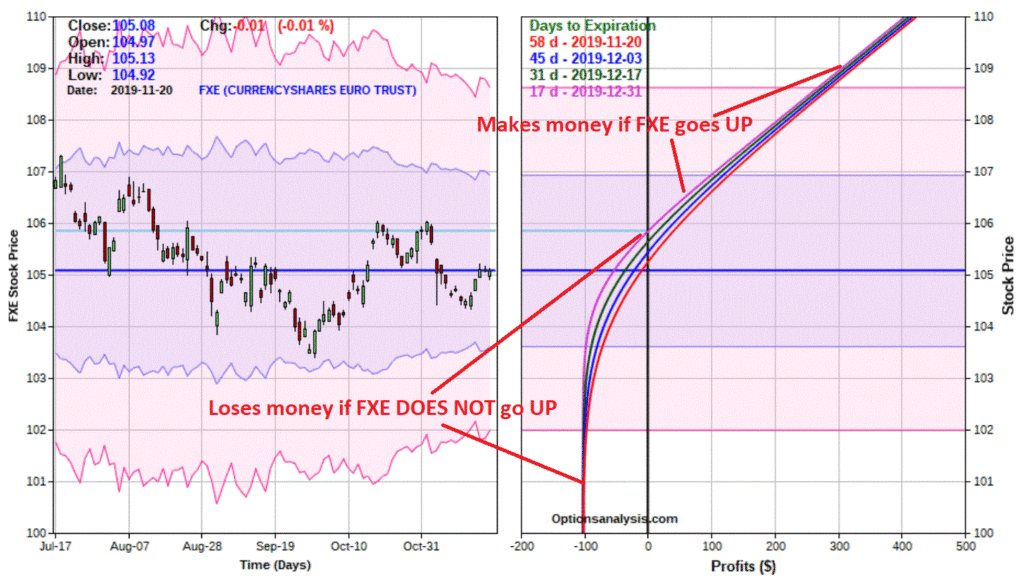
Figures 4 and 5 display the particulars for one possible speculative play designed to make money IF FXE does in fact move higher by December 31st.

Figure 4 – FXE Jan calls(Courtesy www.OptionsAnalysis.com)

Figure 5 – FXE Jan call risk curves (Courtesy www.OptionsAnalysis.com)
One word of caution: Options on FXE are presently very thinly traded. Note that the bid/ask spreads are fairly wide and that a trader may wish to use a limit order and try to split the difference. For purposes of this illustration we will assume that we simply “buy at the ask” price.
A few things to note:
*The risk curves are drawn through December 31st since that is when the “seasonally favorable” period ends (and we will not likely want to hold the position beyond that time)
*The cost to enter the trade – and the maximum risk is $102 per contract
*If FXE does in fact rally this trade can make money above the approximate Dec 31st breakeven price of $105.85 for FXE shares (current price = $105.08).
*If FXE remains unchanged or declines this trade will absolutely lose money
A pretty straightforward “speculative bet” – be right, make money, be wrong, lose money.
Summary
As always, this example trade is not a “recommendation.” It is intended to serve simply as an example of an opportunity that tries to put as many factors in its favor as possible:
*Favorable seasonal trend
*Potentially bullish Elliott Wave count
*Potentially bullish price projection
*Opportunity to buy cheap options
*Low dollar risk
*Limited risk and unlimited profit potential
Will this trade work out favorably? It beats me. But that is the nature of speculation – which also highlights the importance of “position sizing”, i.e., what percentage of one’s capital will one risk on a given trade. In this example, maybe risking 1% to 5% of one’s trading capital might make sense. But “betting the ranch” – i.e., risking a high percentage of one’s capital on a random speculative bet – is an invitation to catastrophe.
So, let’s wrap up with:
Jay’s Trading Maxim #212: If a potential position equates to receiving an invitation to catastrophe, decline the invitation.
Jay Kaeppel
Disclaimer: The information, opinions and ideas expressed herein are for informational and educational purposes only and are based on research conducted and presented solely by the author. The information presented does not represent the views of the author only and does not constitute a complete description of any investment service. In addition, nothing presented herein should be construed as investment advice, as an advertisement or offering of investment advisory services, or as an offer to sell or a solicitation to buy any security. The data presented herein were obtained from various third-party sources. While the data is believed to be reliable, no representation is made as to, and no responsibility, warranty or liability is accepted for the accuracy or completeness of such information. International investments are subject to additional risks such as currency fluctuations, political instability and the potential for illiquid markets. Past performance is no guarantee of future results. There is risk of loss in all trading. Back tested performance does not represent actual performance and should not be interpreted as an indication of such performance. Also, back tested performance results have certain inherent limitations and differs from actual performance because it is achieved with the benefit of hindsight.

