Despite the fact that October has seen some great rallies, it’s reputation as “Crash Month” is tough to shake – especially when the first two days see the stock market sell off. But if we look at things from a historical standpoint, it turns out that a rough October beginning has mostly been a positive sign.
Now I like to think I am all about all things “seasonal”, but the truth is this is one I didn’t know about. At least now until I read this article by Mark DeCambre on Marketwatch.com. In turn, he quoted an analyst from Bespoke Investment Group. So, a lot of help on this one.
If the 1st Day of October…
…is down -1% or more, the market has showed a strong historical tendency to perform quite well between then and the end of the year. There is of course, no guarantee that this time around things won’t be different, but before hitting the panic button consider the following data (FYI: The data I have only goes back to Jan 1, 1934 so my table and chart do not include 1931 and 1933, which also qualified).
Figure 1 displays the performance of the Dow jones Industrial Average from the close of the first trading day of October through December 31st during those years when the Dow lost -1% or more on the first trading day of October.
| Year | 2nd Trading Day of October through Dec 31st % +(-) |
| 1934 | +15.1% |
| 1955 | +7.2% |
| 1956 | +6.6% |
| 1962 | +14.0% |
| 1966 | +3.7% |
| 1975 | +8.7% |
| 1976 | +2.5% |
| 1998 | +20.3% |
| 2009 | +9.7% |
| 2011 | +14.7% |
| 2014 | +6.1% |
Figure 1 – Performance to year-end after Dow down -1% or more on October Trading Day #1
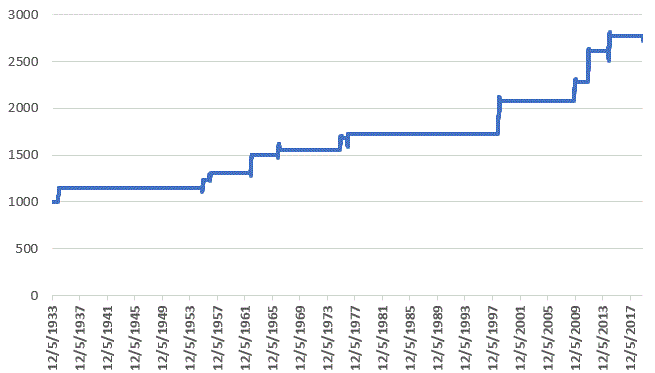
Figure 2 displays the cumulative growth of $1,000 invested in the Dow ONLY from the close of October Trading Day #1 through December 31st IF the Dow lost -1% or more on the first trading day of October.

Figure 2 – Growth of $1,000 invested through year end if 1st trading day of October is down -1% or more
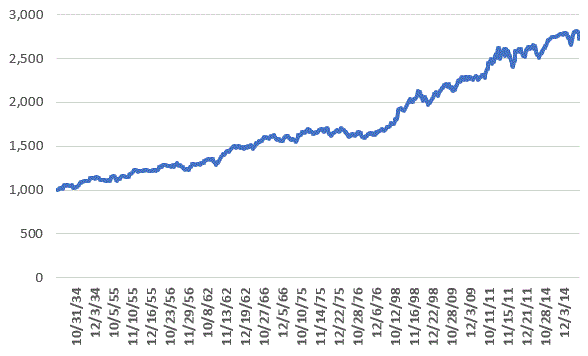
Finally, for some – possibly unneeded – perspective, Figure 3 displays the same data as Figure 2 but includes ONLY days in the market – i.e., all the intervening days between signals are left out.

Figure 3 – Growth of $1,000 invested through year end if 1st trading day of October is down -1% or more (with all days NOT in the market excluded)
Summary
The “Good News” – at least in theory anyway – is that the Dow lost more than -1% on October 1st. The bad news is, a) it also suffered an even bigger loss on October 2nd, so not a good start, and, b) there is absolutely no guarantee that the pattern from previous years (i.e., a higher market by year end) will repeat.
But for what it’s worth, there you have it.
Jay Kaeppel
Disclaimer: The data presented herein were obtained from various third-party sources. While I believe the data to be reliable, no representation is made as to, and no responsibility, warranty or liability is accepted for the accuracy or completeness of such information. The information, opinions and ideas expressed herein are for informational and educational purposes only and do not constitute and should not be construed as investment advice, an advertisement or offering of investment advisory services, or an offer to sell or a solicitation to buy any security.

