Just last week I wrote a piece title “The (Potential) Bullish Case for Bonds”. And as always, there’s nothing I enjoy more than when I publish something intimating a possible bullish move only to see the bottom drop out. But I digress.
Anyway, if you read the original article carefully (you did, right?) then you may recall that the gist of it was as follows:
*The long-term trend in interest rates is almost certainly higher and as a result bond “investors” (“investors” defined as people who buy and hold bonds or bond funds as long-term holdings) should eschew long-term bonds and stick to short-to-intermediates and/or floating rate bonds.
*In the short-term, a) the long-term bond was oversold and near potential support, b) trader sentiment was/still is about as overwhelmingly bearish as it can get, and c) we are entering a seasonally favorable time of year for long-term bonds.
*If long-term bonds took out recent support, then all bullish bets were off.
So, the real point was that if bonds could hold above support there appeared to be a chance for a decent “counter bearish sentiment” rally.
As of yesterday, all bullish bets are off.
As you can see in Figures 1 (TLT as of the close on 10/3) and Figure 2 (30-year treasury bond futures in the early morning hours of 10/4) the long-term bond plummeted through short-term support like a hot knife through butter (i.e., breaking down through support on 10/3 and following through to the downside overnight on 10/4).
(click to enlarge)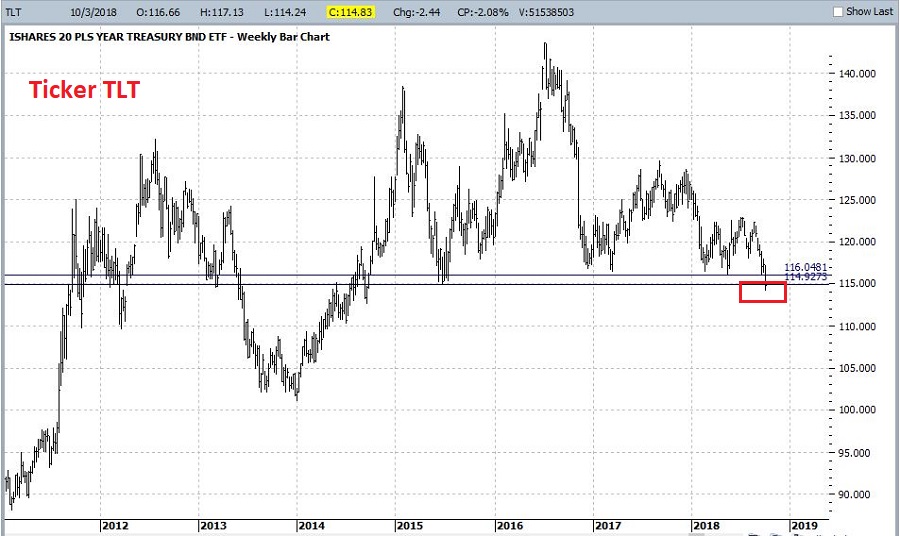 Figure 1 – Ticker TLT breaking support on 10/3 (Courtesy ProfitSource by HUBB)
(click to enlarge)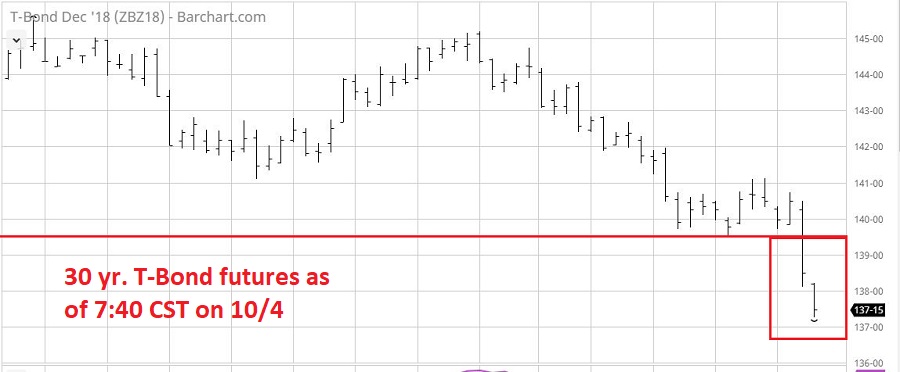 Figure 2 – 30-year treasury bond futures following through to downside on 10/4 (Courtesy ProfitSource by HUBB)
Sometimes price breaks down through support and then immediately reverses, forming a bear trap. And sometimes it breaks down through support and just keeps going. Figures 1 and 2 look like the latter.
To full appreciate the potential significance of this move consider Figure 3 which displays the yield (times 10 for some reason) for the 10-year treasury note.
(click to enlarge)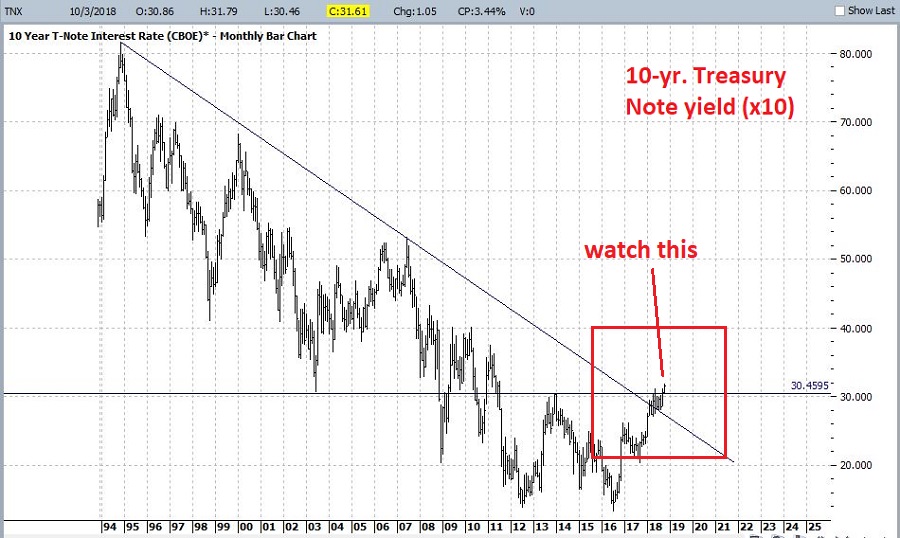 Figure 3 – 10-year treasury note yields appear to be breaking out to the upside (Courtesy ProfitSource by HUBB)
Note that the 10-year yield has moved above the down trending trendline connecting previous peaks as well as a key resistance level. These are not good signs.
Summary
The trend in bonds is clearly “down.” As mentioned above (and in the original article) this has profound impacts for bond “investors” – most notably that holders of long-term bonds stand to get hurt badly if rates continue to rise.
On a shorter-term basis, with sentiment so overwhelmingly bearish do not be surprised to see a surprisingly strong counter rally once the current line runs its course. But that kind of thing is for aggressive traders only.
In the meantime, just remember that trying to catch a falling knife can be painful.
Jay Kaeppel
Disclaimer: The data presented herein were obtained from various third-party sources. While I believe the data to be reliable, no representation is made as to, and no responsibility, warranty or liability is accepted for the accuracy or completeness of such information. The information, opinions and ideas expressed herein are for informational and educational purposes only and do not constitute and should not be construed as investment advice, an advertisement or offering of investment advisory services, or an offer to sell or a solicitation to buy any security.


Jay,
Really enjoyed your interview on BetterSystemTrader. Reading you Seasonal Stock Market Trends.
Reading the section on UMDS, and I’m a little confused. On page 93 you reference figure 4.18, shouldn’t that be figure 4.19 and shouldn’t the graph for figure 4.19 be the graph shown for figure 4.20?
I was trying to find a more discreet why to contact you.
I am finding the book amazing and looking forward to trading some of these on the future.
Best Regards