The U.S. stock market has been leading the rest of the world’s stock markets. Turns out that’s a good thing. As least for U.S. stocks. To illustrate this let’s look at the results achieved from holding the S&P 500 Index only when U.S. stocks are “leading”.
The Test
The indexes used are:
*S&P 500 Index – measures U.S. stock performance
*MSCI World ex US Index – measures the rest of the world
The Calculations
Using monthly total return data from the PEP Database from Callan Associates from 12/31/1971 through 8/31/2018:
A1 and A2;
A1 = The cumulative total return for the S&P 500 over the latest 10 years;
A2 = The cumulative total return for the MSCI over the latest 10 years
B = The difference between A1 and A2 (i.e., SPX total 10-year return minus MSCI total 10-year return)
C = a 36-month exponential moving average of B*
D = Subtracts C from B (i.e., if B above the 36-month EMA or below it)
*If the S&P 500 Index performed better over the previous 10 years then D is positive
*If the MSCI World ex US Index performed better of the previous 10 years then D is negative.
Figure 1 displays Variable B and C above.
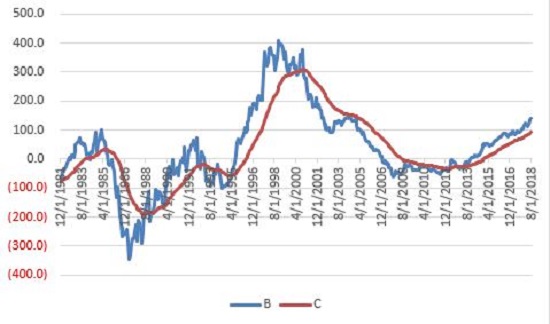
Figure 1 – B (blue line) = difference between SPX 10-year total return and MSCI 10-year total return; C (red line) = 36-month EMA; 12/31/1981-8/31/2018
Figure 2 displays the month-end difference between Variables B and C (i.e. Variable D). When the value is positive SPX is “leading”; when the value is negative MSCI is “leading”.
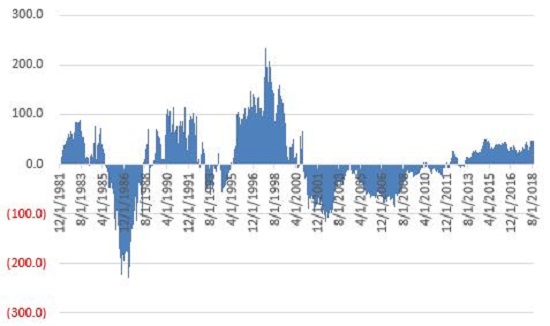
Figure 2 – the month-end difference between Variables B and C (i.e. Variable D); 12/31/1981- 8/31/2018
The Test
For the purposes of this test our only concern is the performance of the S&P 500 Index when Variable D is positive.
Figure 3 displays the growth of $1,000 invested in the S&P 500 Index ONLY when Variable D is positive at the end of the previous month.
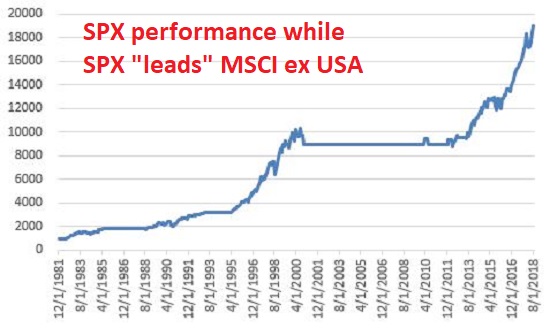
Figure 3 – Growth of $1,000 invested in SPX ONLY when Variable D is positive; 12/31/1981-8/31/2018
As you can see in Figure 3, holding the S&P 500 Index when it is “leading” the MSCI World ex US Index has generated some consistently positive results.
At the moment, Variable D remains firmly in positive territory. Does this mean that the U.S. stock market is impervious to decline? Not at all. Still, the long-term results displayed in Figure 3 represent a fairly compelling piece of evidence for the bullish case.
Lastly, so how did SPX perform when MSCI was leading? Interestingly, it made money. For reference:
*When SPX leads MSCI (when Variable D is positive): SPX gained +1,799%
*When SPX leads MSCI (when Variable D is negative): SPX gained +222%
In sum:
*The SPX did make money (+222%) during those times when MSCI was leading
*However, SPX made 8.1 times as much when SPX was leading than when MSCI was leading
*Also, while MSCI was leading, SPX endured, a) the Crash of 1987, b) the 2000-2002 bear market, and, c) the 2007-2009 bear market (see Figure 4), i.e., all good things to avoid.
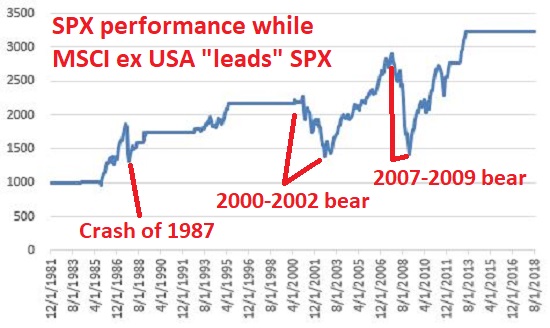
Figure 4 – Growth of $1,000 invested in SPX ONLY when Variable D is negative; 12/31/1981-8/31/2018
To put it as succinctly as possible: U-S-A, U-S-A!!
Jay Kaeppel
Disclaimer: The data presented herein were obtained from various third-party sources. While I believe the data to be reliable, no representation is made as to, and no responsibility, warranty or liability is accepted for the accuracy or completeness of such information. The information, opinions and ideas expressed herein are for informational and educational purposes only and do not constitute and should not be construed as investment advice, an advertisement or offering of investment advisory services, or an offer to sell or a solicitation to buy any security.


Great post! Would you achieve better results if you switched between MSCI ex USA and SPX depending on who leads?