Every once in awhile I stumble across a study regarding what would happen to your long-term returns if you missed the “best” days in the stock market. This article is usually written to argue for buying and holding in the stock market and to highlight the apparent folly of trying to “time” the market. In other words, if you miss just a handful of the biggest daily gains the argument goes, your long-term returns suffer greatly.
Mathematically it seems to make sense. Likewise, as a guy who long ago thought he had a “crystal ball” for timing stock market buys and sells (I stared in to that da%& thing for a long time before I finally realized that it didn’t actually work…but I digress), I am well versed in the pitfalls of trying to “pick tops and bottoms with uncanny accuracy” (even though, truth be told I still love the way that phrase sounds…again, I digress).
Still, the funny thing is, despite the purported folly of NOT buying-and-holding – the one thing I hate more than missing the occasional “best day” is riding the occasional 20%, 30% or 40% or more bear market all the way to the bottom. So – truth be told – I’ll probably continue to take my chances.
But, here’s a different thought: Would it be a good thing to miss some of the “Bad Days? And is there a relatively simple way to do so? Turns out the answers are “Yes” and “Yes”.
Trading Days of the Month
So here is how we roll: the last trading day of the month is referred to as TDM (trading day of month) #-1. The day before that is TDM -2, the one before that is -3 and so on and so forth.
So, for our test:
We are going to use S&P 500 Index daily price data from 12/31/1927 through 12/31/2017 (i.e., 90 years of daily price data)
We divide each month into two parts:
“Bad Days” = TDM #-10 through TDM #-5 (i.e., 6 contiguous trading days)
“Good Days” = All other trading days of the month.
Figure 1 displays the growth of $1,000 invested in the S&P 500 Index ONLY during all the “Bad Days.”
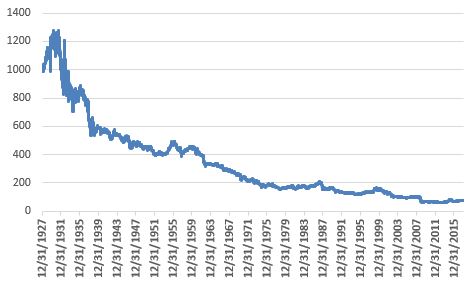
Figure 1 – Growth of $1,000 invested in the S&P 500 Index ONLY during the “Bad Days” (TDM -10 through TDM -5) every month; 12/31/1927-12/31/2017
As you can see in Figure 1, the “Bad Days” have in fact been pretty “bad”. Here are the net results – Cumulative % returns from 12/31/1927-12/31/2017:
*All Days (i.e., buy and hold = +15,039%
*Bad Days (i.e., TDM -10 through TDM -5) = (-92%)
*Good Days (i.e., all other trading days of month) = +195,671%
Figure 2 displays the results of “Good Days” and “Bad Days” by month over the full test period.
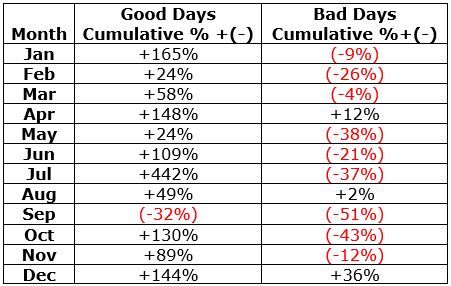
Figure 2 – “Good Days” % return versus “Bad Days” % return by month; 12/31/1927-12/31/2017
As you can see in Figure 2:
*The “Good Days” made money in every month except September
*The “Bad Days” lost money in every month except April, August and especially December
Summary
Does it really make sense to “sell everything” for 6 trading days every month? That’s not for me to say. Still, the fact that the “Bad Days” lost a cumulative -92% over the past 90 years suggests there might be a “there”, um, “there.”
Jay Kaeppel
Disclaimer: The data presented herein were obtained from various third-party sources. While I believe the data to be reliable, no representation is made as to, and no responsibility, warranty or liability is accepted for the accuracy or completeness of such information. The information, opinions and ideas expressed herein are for informational and educational purposes only and do not constitute and should not be construed as investment advice, an advertisement or offering of investment advisory services, or an offer to sell or a solicitation to buy any security.


Jay…Great article. Not trying to be picky, the two Bad day descriptions are different. I believe second one should not have NOT in it.
Satish, Good catch…I corrected the second entry (took out the NOT). Thanks, Jay
Nice article/strategy. Seems overly simple but the results speak for themselves. it would be great to see the results from the last 20 years along with being broken out by year. That way we could see how consistent or inconsistent the strategy has been from year to year.
Jay, previously you have looked at best days of month across US markets in addition to differing country ETF’s. Do the bad days of the month mentioned also impact other countries?
You’ve done several studies of this type… being or out of the market on particular days. I love reading them and end up wishing I were 30 years younger so I could set up real money tests! For now, it would be more interesting to see results of such studies for the monthly (or whatever) holding/avoiding periods, for each year. Any chance of seeing data this way? Thanks.
James Heath