I am in the camp that believes that the great interest rate decline that started in the early 1980’s has run its course and that the long-term trend in rates is now to the upside. I also think it could be a long slow process and that bonds can stage some good rallies along the way. I also recognize that I could be wrong.
A Buy Signal for Long Bonds?
A useful indicator I learned a long time ago from Tom McClellan is one that I refer to as “UpDays20”. It involves simply counting the number of times the long bond has experienced a higher close over the past 20 days. I have made a few minor changes in the way I look at it, as follows:
*With the long bond I look at weekly data instead of daily data (i.e., the number of weeks that have seen a weekly gain over the past 20 weeks)
*I also use a 30-week version (i.e., the number of weeks that have seen a weekly gain over the past 30 weeks)
Also, for calculation purposes I like to have 0 as the neutral line, so
Updays20 = Total # of up closes over latest 20 periods minus 10
Updays30 = Total # of up closes over 30 latest periods minus 15
For signal purposes, a “Buy Alert” occurs when:
Step 1: Both Updays20 and Updays30 drop to -2 or lower and then rise by 2 (more explanation in a moment)
Step 2: After Step 1 look for a high this week that is above the high of the previous week
Explanation:
If Updays20 drops to -2 and then later moves back up to 0, then that indicator gives an alert. IF it drops to -3 and then moves up to -1, that is also an alert. Same for a reading of -4 and a subsequent move to -2. Same for Updays30.
Clear as mud, right? That’s why charts were invented. Figures 1 through 5 display the signals for this method since ticker TLT (an ETF that tracks the long-term treasury bond) started trading.
(click to enlarge)
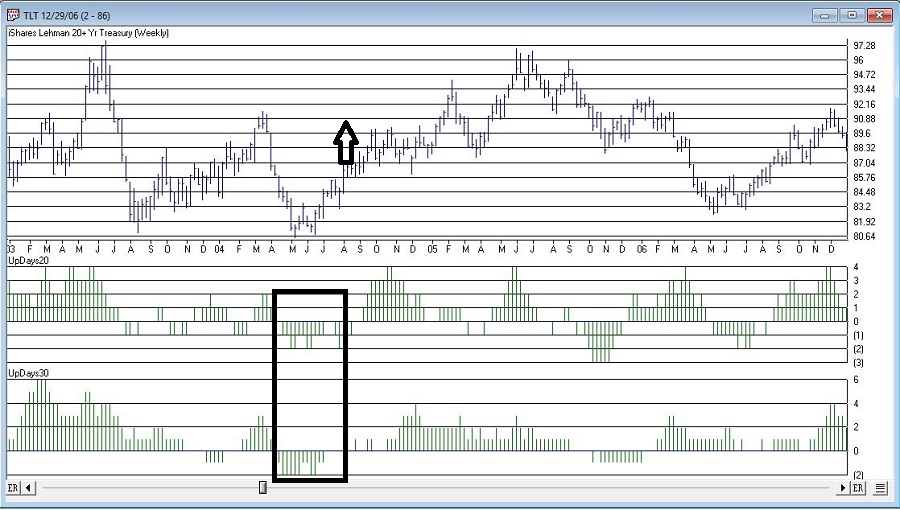 Figure 1 – TLT w/Buy Alert Signals (Courtesy AIQ TradingExpert)
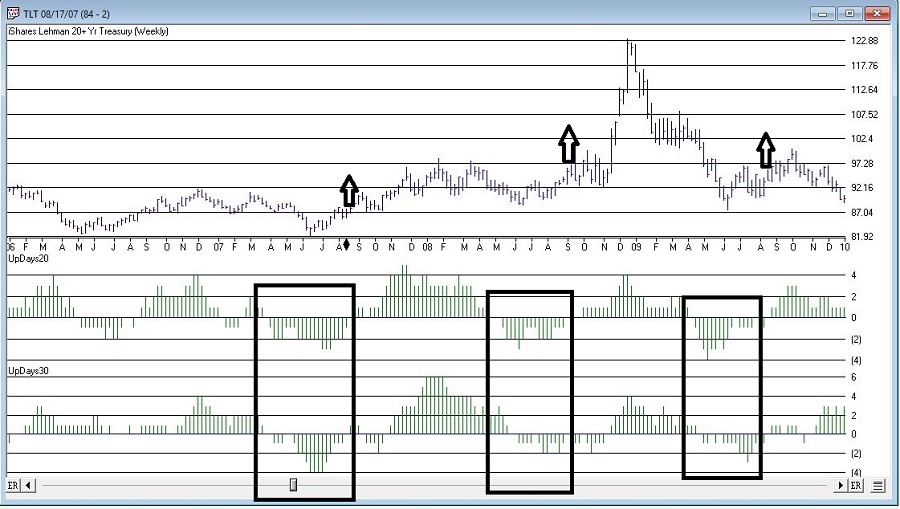 Figure 2 – TLT w/Buy Alert Signals (Courtesy AIQ TradingExpert)
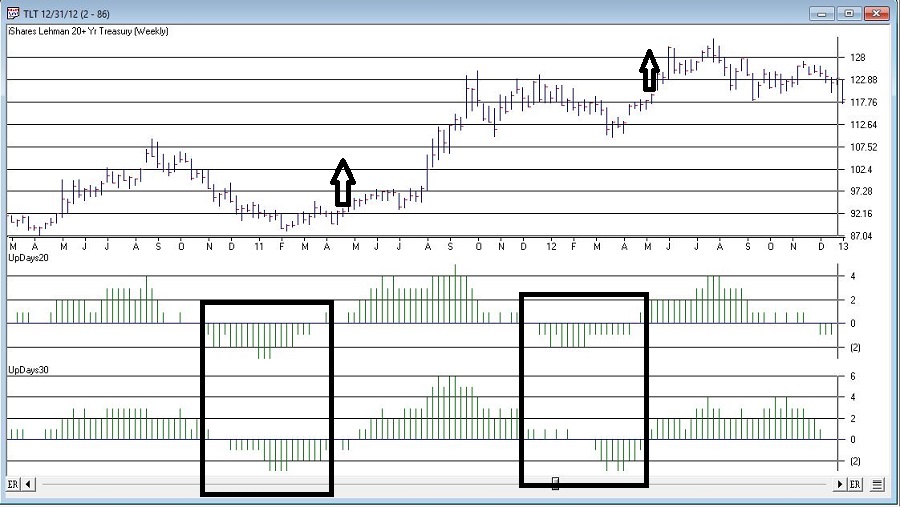 Figure 3 – TLT w/Buy Alert Signals (Courtesy AIQ TradingExpert)
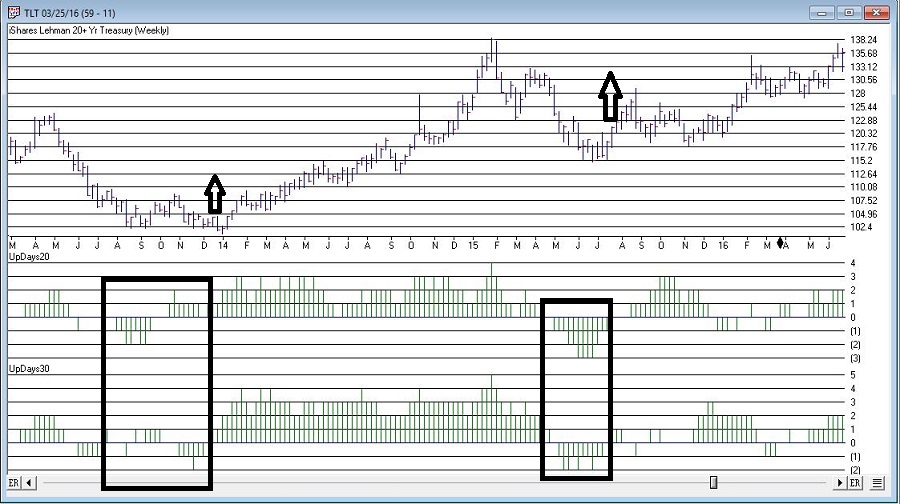 Figure 4 – TLT w/Buy Alert Signals (Courtesy AIQ TradingExpert)
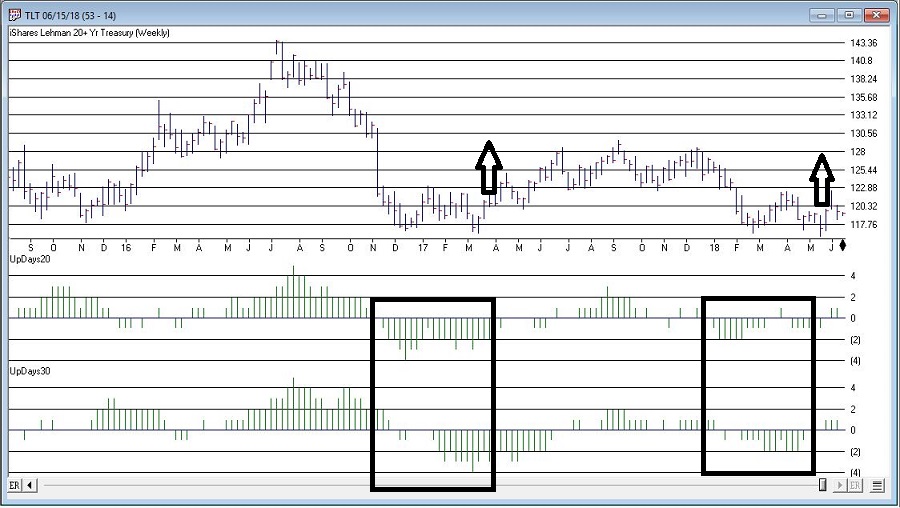 Figure 5 – TLT w/Buy Alert Signals (Courtesy AIQ TradingExpert)
The latest buy alert occurred on 5/24/2018 when TLT hit 119.00. Does this signal mean that long-term treasuries are due to rally? Not necessarily. As you can see in Figures 1 through 5, like a lot of “methods” this one has generated some terrific buy signals, some OK buy signals and some not so useful buy signals.
If history is a guide there is a chance for a surprisingly good rally in the long bond in the weeks/months ahead. But here is the point: If bonds DO NOT rally here it may be another ominous warning sign that the long-term trend for bonds is not so bright.
So, pay close attention in the weeks ahead
Jay Kaeppel
Disclaimer: The data presented herein were obtained from various third-party sources. While I believe the data to be reliable, no representation is made as to, and no responsibility, warranty or liability is accepted for the accuracy or completeness of such information. The information, opinions and ideas expressed herein are for informational and educational purposes only and do not constitute and should not be construed as investment advice, an advertisement or offering of investment advisory services, or an offer to sell or a solicitation to buy any security.

