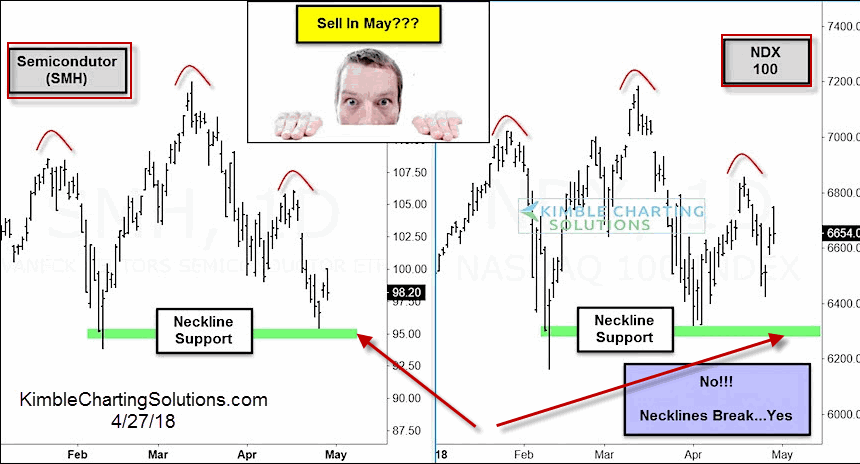
The chart below is courtesy of www.KimbleChartingSolutions.com. The link to the actual chart is here.
According to their analysis two key areas – semiconductors and Nasdaq stocks – may be forming an inverse head and shoulder pattern. You can see Kimble’s “line in the sand” for SMH and NDX in Figure 1 below.
 Figure 1 – Semiconductors and Nasdaq stocks potential warning signs (Courtesy: www.KimbleChartingSolutions.com)
(See also The (Semi) Official S&P 500 Index ‘Line in the Sand’)
The implication is pretty clear. If these two key sectors “give up the ghost” and drop below the necklines drawn in Figure 1, it could well serve as a major warning sign for the overall stock markets.
So stay focused.
Jay Kaeppel
Disclaimer: The data presented herein were obtained from various third-party sources. While I believe the data to be reliable, no representation is made as to, and no responsibility, warranty or liability is accepted for the accuracy or completeness of such information. The information, opinions and ideas expressed herein are for informational and educational purposes only and do not constitute and should not be construed as investment advice, an advertisement or offering of investment advisory services, or an offer to sell or a solicitation to buy any security.

