As a semi-mindless trend-follower blithely riding a bull market I hate to sound like the “boy who cried wolf”. I’d rather just enjoy the ride. But in the spirit of the “If you see something, say something” age one “potential” warning sign has appeared recently. In fact I wish I had written about it before the market plunge the other day.
(See also The Ultimate “Sell in May” Sector)
The JK HiLoIndex (JKHLI)
The indicator I am referring to – the JK HiLo Index is one I developed myself simply by combining one indicator I learned from Norman Fosback and the other from Gerald Appel.
The theory underlying JKHLI is this:
*Low readings signal “fear” and are bullish
*High readings signal “churning” in the market and are bearish
For the record I use this indicator as a “perspective” indicator and not as an actual “buy/sell” trigger. In order to (hopefully) avoid people getting bored and stopping reading before we get to the “meat”, the calculations appear at the end of the article. Figure 1 displays the daily indicator values in blue and the Nasdaq Composite Index in red, since January 1988. Figure 1 – JK HiLo Index (blue) versus Nasdaq Composite Index (red); 1988-present
*JKHLI readings under 20 tend to mark at least short-term bottoms in the stock market.
*JKHLI readings above 100 are considered a “warning” (but not a “sell signal”) and readings above 150 are rare and have typically suggested some trouble ahead for the markets.
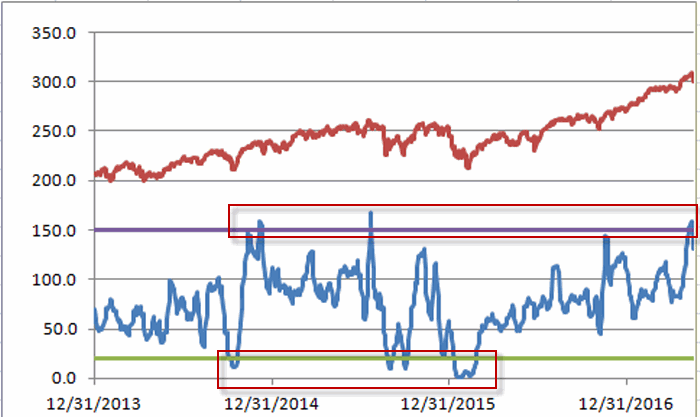
Figure 2 displays the JKHLI and Nasdaq Composite since 12/31/2013. Note there have been 3 periods of <20 readings and 3 periods of >150 readings. The <20 reading occurred near lows. The first >150 reading occurred in December 2014. From there the Nasdaq traded sideways for 19 months. The 2nd >150 reading occurred in July 2015. 7 months later the Nasdaq bottomed out 17% lower. The 3rd >150 reading occurred on 5/10/17 just prior to the 5/17 selloff. Is there more sideways to lower action in the months ahead?
 Figure 2 – JK HiLo Index (blue) versus Nasdaq Composite Index (red); 12/31/2013-present
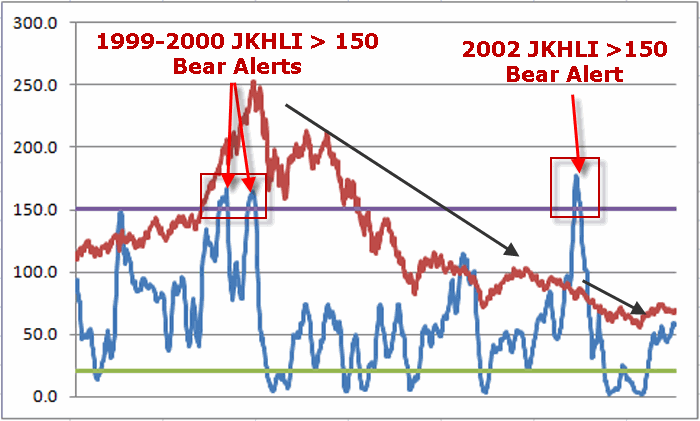
Previous >150 readings occurred in late 1999 and early 2000 just prior to the great bear market that ultimately saw the Nasdaq lose -75% of its value, and in May 2002 just prior to the final -34% plunge to the bear market low. Figure 3 – JK HiLo Index (blue) versus Nasdaq Composite Index (red); 12/31/1998-12/31/2002)
Note in Figure 3 that there were a number of <20 readings during the 2000-2002 bear market. While the ensuing rallies were often short-lived, most of these readings did coincide with at least short-term market lows.
So does the May 2017 JK HiLo Index reading above 150 mean the market is in trouble? Not necessarily. But it does suggest that a little bit of caution may be in order in the months ahead.
(See also The Sordid Past of Years Ending in ‘7’)
JK HiLo Index Calculations:
A = Daily Nasdaq Issues Traded
B = Daily Nasdaq New Highs
C = Daily Nasdaq New Lows
D = Lower of B and C
E = (D / A) * 100 (the lower of new highs and new lows divided by total number of issues traded)
NOTE: Value E is Norman Fosback’s Hi/Lo Logic Index applied to Nasdaq
F = 10-day simple moving average of E
G = B / (B + C) (i.e., new highs divided by total of news highs plus new lows)
H = 10-day simple moving average of G
NOTE: From Gerald Appel, value H ranges from 0 to 1. 0 would mean there were 0 new highs and 1 would mean no new lows.
JK HiLo Index = (E * H)
In other words, JK HiLo Index is derived by multiplying Fosback’s HiLo Logic Index times Appel’s HiLo percent indicator.
Jay Kaeppel
Disclaimer: The data presented herein were obtained from various third-party sources. While I believe the data to be reliable, no representation is made as to, and no responsibility, warranty or liability is accepted for the accuracy or completeness of such information. The information, opinions and ideas expressed herein are for informational and educational purposes only and do not constitute and should not be construed as investment advice, an advertisement or offering of investment advisory services, or an offer to sell or a solicitation to buy any security.


Very solid work Jay.
Thank you for sharing.
Much appreciated.