There are few things in life better than “summer leisure”. Unless you are trying to make from it. Then you may be barking up the wrong tree.
(See also Biotech at the Crossroads)
Ticker FDLSX
Ticker FDLSX is the Fidelity Select Leisure Portfolio sector fund. This fund presently holds roughly 55% of its portfolio in restaurant stocks, 16% in hotels, resorts and cruise lines and 11% in casino and gaming stocks.
Like FSHOX, which I wrote about here, the months of November and May are “where the action is” and the months of June through October are where “a whole lot of nothing is”.
Let’s compare the November through May performance to the June through October performance since inception in 1984.
| Measure | Bull Period | Bear Period |
| # times UP | 28 | 22 |
| # times DOWN | 5 | 11 |
| Median % +(-) | +12.7% | +3.0% |
| Average % gain | +18.7% | +7.5% |
| Average % loss | (-7.3%) | (-12.1%) |
| Total % Gain | +7,141% | +8.0% |
Figure 1 – FDLSX November thru May Bull Period versus June thru October Bear Period
At first blush it can be argued that the June through October bear period “isn’t that bad.” This period has seen leisure stocks register a gain fully 66% of the time and a median gain of +3% over a 5-month period is certainly not the worst performance anyone has ever seen.
But the key piece of information is contained in the last row of Figure 1:
*The “bull period” has seen FDLSX gain over +7,100%.
*The “bear period” has witnessed a net gain of all of +8%. That’s over 165 months (5 months a year times 33 years).
For the record, June through October has seen FDLSX register gains of +24.9% (1994), +17.5% in 1998 and +17.2% in 1985. So understand that there is no “prediction” being made here about 2017. A sharply higher price for FDLSX is absolutely a possibility. But note also that the June through October period has also seen FDLSX register losses of -26.1% in 2009, -24.5% in 1991, -22.4% in 2002 and -20.1% in 1988. These are the kinds of hits that can take a long time to recover from – both financially and psychologically.
The equity curves make the performance differences quite clear. Figure 2 displays the growth of $1,000 invested in FDLSX only during the months of November through May starting in 1984.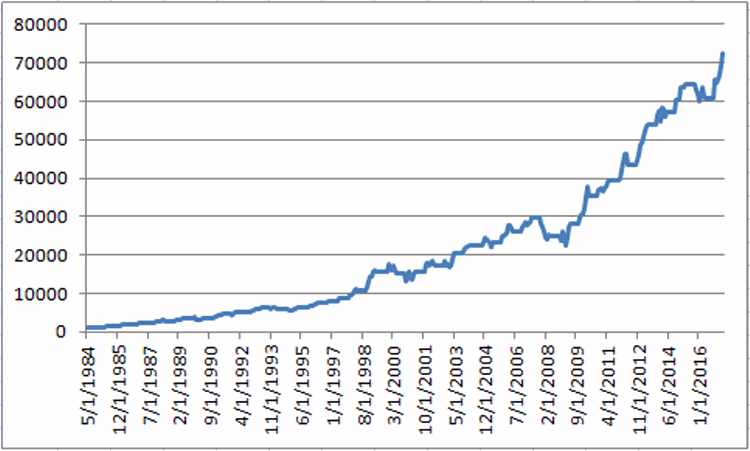 Figure 2 – Growth of $1,000 invested in ticker FDLSX November through May (1984-present)
Figure 3 displays the growth of $1,000 invested in FDLSX only during the months of June through October.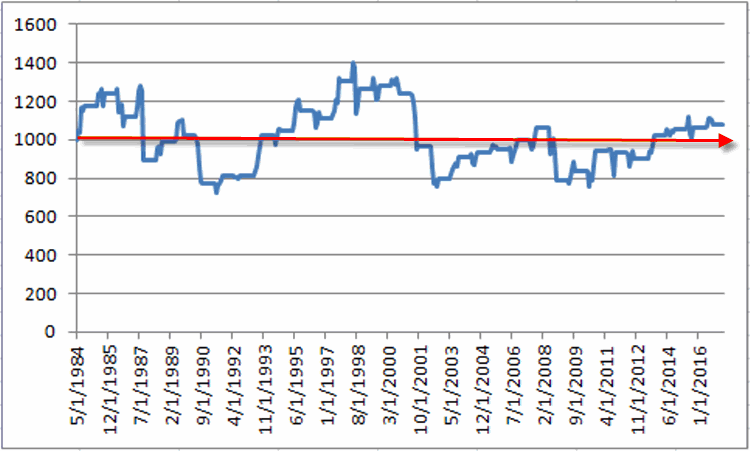 Figure 3 – Growth of $1,000 invested in ticker FDLSX June through October (1984-present)
A long look at Figure 3 renders the fact that 66% of the years showed a gain a lot less significant than it sounds. Essentially just a roller coaster ride that ends up about where it started.
(See also The ‘Range Bound Consolidation Pattern’)
Summary
All things considered it can be argued that leisure stocks are not the worst possible investment someone could choose for the summer months. But with a net gain of +8% over the past 33 “summers” the phrase “Dead Money” doesn’t seem out of line.
So are leisure related stocks guaranteed to fall – or even underperform – between 5/31/2017 and 10/31/2017? Not at all. But the bottom line is this: eat at all the restaurants you want, gamble, go on a cruise, and relax on the beach, whatever.
But if you are looking to make money, you might do well to look elsewhere.
Jay Kaeppel
Disclaimer: The data presented herein were obtained from various third-party sources. While I believe the data to be reliable, no representation is made as to, and no responsibility, warranty or liability is accepted for the accuracy or completeness of such information. The information, opinions and ideas expressed herein are for informational and educational purposes only and do not constitute and should not be construed as investment advice, an advertisement or offering of investment advisory services, or an offer to sell or a solicitation to buy any security.

