Monthly Archives: June 2015

A Play in Natural Gas ETF

See also Jay Kaeppel Named Portfolio Manager for New Investment Program

Note the use of the word “play” in the title, and the lack of the word “recommendation.”  I recently wrote here about the fact that natural gas has showed a historical tendency to advance over the three days encompassed by June trading days number 9, 10 and 11.  This is clearly a speculative idea and granted, one that the majority of traders are not inclined to “jump on.”

But for illustrative purposes, when it comes to playing purely speculative ideas there are usually a variety of ways to play.  To wit, a trader could make one of the following trades at the close:

1) Enter a long position at the close in natural gas futures and hold for three days;

2) Buy 100 shares of ETF ticker UNG, trading at $14 as I write, or $1,400.

3) Buy 1 June UNG 13 strike price call (as I write trading at $1.02 bid/$1.10 ask – i.e, if bought at the market would cost $110).

So if things were unchanged by the close of trading a trader could enter a call option position for a total cost (and risk) of $110 by buying the June UNG call option.

Summary          

The purpose here is not to try to prompt you to enter a trade in natural gas.  I basically just want to follow through with keeping up to date on an idea I wrote about a little while ago and to alert you to the fact that there are “low risk” ways to let the “wild-eyed speculator” in you out of its cage once in a while – i.e., in this case via a cheap, in-the-money call option.

Jay Kaeppel


Keep a Close Eye on Crude Oil Right Now

See also Jay Kaeppel Named Portfolio Manager for New Investment Program

Keep a close eye on crude oil.  As I write crude is breaking out above a declining upper trend line as seen in Figure 1.  Whether this breakout proves to be “for real” or a “fake out” may well have important implications moving forward.

1Figure 1 – Crude Oil attempting to breakout to the upside (Chart courtesy of www.Barchart.com)

As you can see in Figures 2 and 3 (and as I wrote about here), both the daily and weekly Elliott Wave counts for crude are pointing decidedly to the bearish side. 2Figure 2 – Daily crude oil with Elliott Wave count (Courtesy: ProfitSource by HUBB)

3Figure 3 – Weekly crude oil with Elliott Wave count (Courtesy: ProfitSource by HUBB)

Look for one of two scenarios to develop from here:

1) The current breakout proves to be “for real” and the bearish Elliott Wave counts go “poof” and vanish into the ether (and don’t you just hate that about Elliott Wave counts?)

2)The current breakout proves to be a “fake out” and crude reverses back to the downside.

If crude does reverse back to the downside after this current pop runs its course, then the likelihood of another serious leg down for crude increases greatly.

Now this is what I call a potential “Summer Blockbuster” so I will be watching intently.  Hmm, where’s my popcorn?

Jay Kaeppel

One Way to Play the Stock Market Black Hole (i.e., “Summer”)

Please see also Jay Kaeppel named Portfolio Manager for New Investment Program

I last wrote about the fact that over the past 50 years, the Dow Jones Industrials Average has gained almost exactly zero net points during the months of June, July and August.  I also highlighted the fact that in light of this performance, investors and traders might need to get a little “creative” if they actually wish to make money during these months.  So this time out, let’s “get a little creative” and highlight one possible way to potentially take advantage of “summer boredom.”

(For other “Summer Strategies” see Jay’s recent posts: Will Natural Gas Break Wind in June? and Will Natural Gas Soar With the Wind in June?

This method involves a simple, commonly used option trading strategy.  So of course, if you have no interest in options then you are free to stop reading here.  Thanks for checking in and please come back soon.  But before you sign off you might want to take one more glance at Figure 1 here and verify that you have no interest in considering alternatives to just “riding the market” for the next several months.  (If you are an option trader please see the Special Offer to JayOnTheMarkets.com readers here).

Jay’s How to “Enjoy Summer Boredom” (ESB) Strategy

This method is based on the theory that big stock market moves in the summertime have shown a historical tendency to (WARNING: Impending “Highly Technical Trading Term”) “peter out”.  However, this does not mean that every time a stock shoots higher for a few days that it marks a major top and signals an impending sharp decline.  It is just not an uncommon event for a given stock to pop higher and then “meander” sideways to lower for a period of time.  One way to potentially take advantage of this situation with stocks that you do not hold is to enter into a bear call credit spread.  This involves selling an at-the-money or out-of-the-money call option on a stock or index and simultaneously buying a further out-of-the-money call option on the same stock or index.  More money is taken in for the option sold than is paid out for the option bought.

Hopefully as the stock “meanders” sideways to lower, the options lose value and the position can eventually be bought back (or expire) for less than the amount received when the position was entered.  The example that follows should answer any questions about the mechanics of the bear call credit spread.

Jay’s ESB Trading Rules:

-Today is during the months of June, July or August

-The 2-day RSI for a given stock or index is >=90

-The 14-day ADX value for that stock is below 25

-Ideally at least 1,000 options are traded per day for the stock in question and the bid/ask spreads are 2% or less

(A higher degree of confidence if ticker SPY or QQQ or RUT or VTI also show a 2-day RSI>=80 and/or if the 2-day RSI rises to 80 or above and then reverses for one day; but this is not a requirement)

-When this setup occurs selling an at-the-money or out of the money call option with 14 to 45 days left until expiration and buying another higher strike price call option.

Example

As you see in Figure 1, on 7/15/14 the 2-day RSI for SPY reversed lower after topping 80%.1Figure 1 – SPY 2-day RSI reverses lower from above 80% (Courtesy: www.AIQSystems.com)

From here all of the analysis is done using www.OptionsAnalysis.com the software I use for all of my, well, option analysis, what else?  (If you are an option trader please see the Special Offer to JayOnTheMarkets.com readers here).

We first go to Web Site | Lists | Filter List. The settings in Figure 2 are used to find stocks that have reasonable option volume and reasonably tight bid/ask spread on those options.

(Click on Figures below to enlarge them)2Figure 2 – Looking for good option volume and tight bid/ask spreads (Courtesy www.OptionsAnalysis.com)

As you can see in Figure 3, this leaves us with 386 “high option volume, tight bid/ask spread” candidates.3Figure 3 – Stock List Filter Output; 386 high option volume, low bid-ask spread candidates  (Courtesy www.OptionsAnalysis.com)

We save these stocks to a “My Stock List” then go to Stocks | Rankers | RSI.

Figure 4 displays the input screen which allows us to look through the 386 tocks we just saved and find only those that have a 2-day RSI reading of 90% or higher.4Figure 4 – Finding Stocks with 2-day RSI >= 90 (Courtesy www.OptionsAnalysis.com)

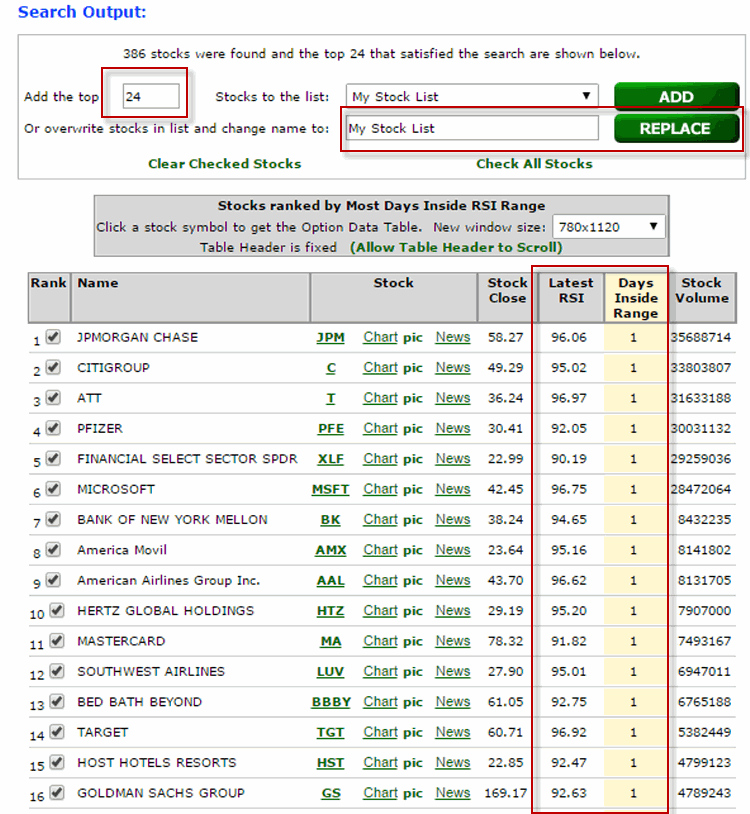
Figure 5 displays the output.  We now have 24 stocks that meet our option volume and option bid-ask spread requirements and 2-day RSI readings >=90%. We save these by overwriting My Stock List with these 24 securities by clicking “Replace”.5Figure 5  – Stocks with 2-day RSI >= 90 (Courtesy www.OptionsAnalysis.com)
*Next we go to Searchers | Multi-Strategies | Find Trades II.

In this routine I have created a “Wizard” for finding bear call credit spreads.  This Wizard is selected by selecting “JK Test 1 Bear Call Credit” under “Saved Searches” and clicking “Replace” as shown in Figure 6.6Figure 6 – Selecting Jay’s Bear Call Credit Spread Saved Search (Courtesy www.OptionsAnalysis.com)

This selects the bear call credit spread strategy and sets the default strategy inputs displayed in Figure 7.

7Figure 7 – Jay’s Bear Call Credit Input Criteria Settings (Courtesy www.OptionsAnalysis.com)

Among these inputs are:

*A Probability of Profit of 75% or more

*Stock Price >= $10

*Minimum sell price for an option is $0.50

*Minimum Option Volume is 1

*Minimum Option Open Interest is 100

*An option must have an active “Real Quote” in order to be considered

*Between 14 and 45 days left until expiration

*The call option sold must have a Delta of less than50.

Not shown is the fact that the selected “Sorting Criteria” is “Expected Profit/Risk.”

Figure 8 displays the trade output screen. In this case all of the top suggested trades were for ticker AAL.8Figure 8 – Multi-Strategies Output screen (Courtesy www.OptionsAnalysis.com)

If we click on the top trade we get the particulars for that trade which appears in Figure 8.  Note that I arbitrarily chose to display this trade as a 10-lot.  This trade involves:

*Selling 10 AAL August 46 calls

*Buying 10 AAL August 50 calls

9Figure 9 – AAL August 46-50 Bear Call Credit particulars (Courtesy www.OptionsAnalysis.com)

Key things to note about this trade:

*Maximum profit potential = $800

*Maximum risk = $3,200

*Current stock price = $43.70

*Breakeven price = $46.80

*31 days left until option expiration

Figure 10 displays the risk curves for this trade.  Each of the four colored lines displayed represents the expected $ profit or loss at a given stock price for four different dates.  Below the breakeven price of $46.80 we see the lines drifting to the right (further into the profit zone).  This illustrates the potentially positive effect of time decay working in our favor.10Figure 10 – Risk curves for AAL August Bear Call Credit Spread (Courtesy www.OptionsAnalysis.com)

So Then What?

So let’s assume this trade was entered just as displayed in Figures 9 and 10. A trader has to decide (actually for the record these decisions should be made before entering the trade) when to take a profit and when to cut a loss.  As with many things in trading there are no “Perfect Rules”.  And in fact, there are too many possibilities to lit and discuss here.  So let’s just choose some for examples sake and see what happened going forward.

Profit Taking Ideas:

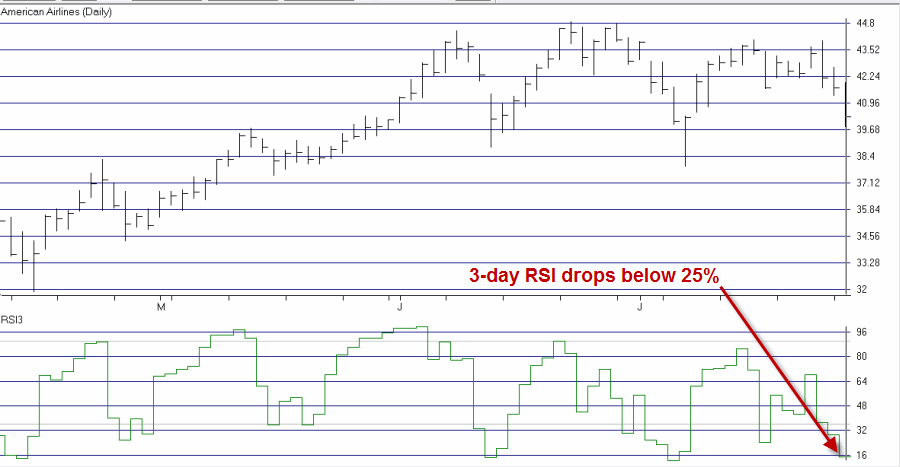
*If the 3-day RSI drops below 25% and we have a profit of any amount we may consider closing half of the open position.

*If we achieve an open profit of 20% or more prior to expiration (remember 25%, i.e., $800 / $3,200 – is our maximum profit potential) we may consider taking a profit and closing the entire position.

*As long as stock remains below price of option sold ($46) we can consider holding the position until option expiration.

Loss Cutting Ideas:

*If the stock breaks out above recent resistance at $44.88.

*If the position shows an open loss above $x (each trader needs to decide for themselves what value x should be)

*Cut a loss in the area where the various risk curve lines cross – in this case that is somewhere between $46.80 and $47.50.  Again, each trader would need to decide for themselves.

So for example purposes, we will:

*Exit with a loss if AAL reaches or exceeds $46.80.

*Exit with a profit of 20% or more.

 The Result

As you can see in Figure 11, by 7/28 AAL stock had fallen to $40.29 a shares, the 3-day RSI had dropped below 25%.11Figure 11 – AAL stock declines triggering a profit-taking opportunity
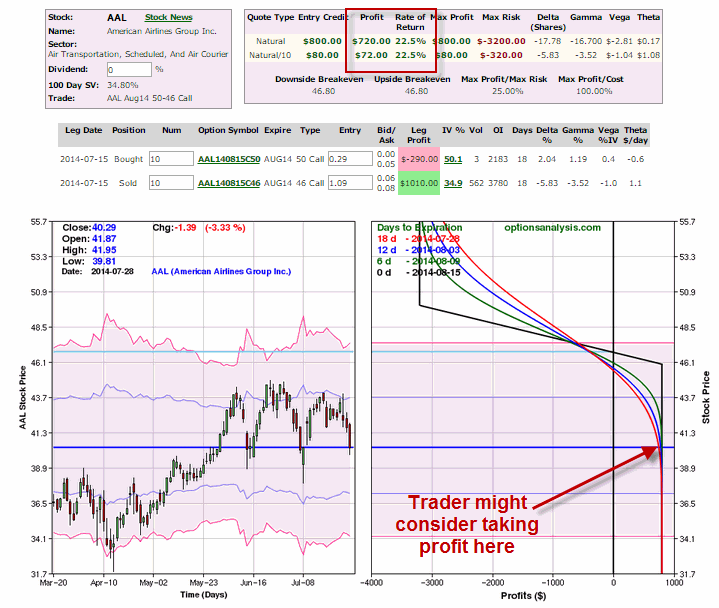
As you can see in Figure 12, at this point the trade was showing an open profit of $720 or 22.5%.  At this point a trader could have closed the trade generating a profit of 22.5% in 13 calendar days.12Figure 12 – AAL Bear Call Credit profit-taking opportunity (Courtesy www.OptionsAnalysis.com)
Summary

Now comes the important part.  Repeat after me: “Not every trade will work out as well as this one.”  Please repeat that phrase two or three, um, hundred times before proceeding.

The trade in this example serves only as an illustration.  The key thing to note is the process which is intended to find trades that can put the odds in your favor and potentially take advantage of the “summer doldrums”.

Jay Kaeppel


The Stock Market Black Hole (formerly known as “Summer”)

Please see also Jay Kaeppel named Portfolio Manager for New Investment Program

Just in case you somehow missed the 12,356 obligatory “Sell in May” related articles (alas, including this one), let me just say either:

You don’t read financial articles very often do you?

or

Congratulations on recovering from your coma and Welcome Back!

Either way, the gist of conventional wisdom is that the stock market is a bad place to be after May and until sometime much later in the year.  Typically, conventional wisdom in the stock market is best avoided.  But in this case, there may be some truth to the rumor.

Consider the chart that appears in Figure 1.  This line represent the growth of $1,000 invested in the Dow Jones Industrials Average only during the months of June, July and August, every year starting in 1965. 1Figure 1 – Growth of $1,000 invested in Dow Jones Industrials Average only during June, July and August; 12/31/194-5/29/2015

Now it is not as if the market hasn’t had some ups and downs along the way – it has.  But the net result is – far lack of a better phrase – “a whole lotta nothin’.”

For the record:

*$1,000 invested only during June, July and August since 1965 was worth $982 as of 5/31/2015.  Talk about “dead money.”

*This period showed a gain 28 times

*This period showed a loss 22 times

*The average gain was +5.05%

*The average loss was (-5.92%)

Summary

So what are the implications for summer of 2015?  Truth be told, I am not so sure there are any.  Other than the notion that if a trader or investor wants to make money over the next several months he or she may have to do something besides “just sit there.”  A little “creativity” may be in order.

Jay Kaeppel


One Last Fizz Enhancer for Coca-Cola

In Part 1, Part 2 and Part 3, I highlighted the best times of year to hold a long position in ticker KO and a simple (albeit by no means, “low risk”) strategy for maximizing long term returns by investing during those periods using margin.  In this piece I want to mention one “when not to invest in KO” period.

Unavorable Seasonal Period for KO

*This period starts at the close of December Trading Day #17

*This period extends through January Trading Day #20 (or the close of the last trading day of January if there are fewer than 20 trading days in January)

Let’s say that Investor C had started with $1,000 in December 1981 and had been just stubborn enough to buy and hold KO shares only during this time frame every year since (pause here and wait for the face of the relative of yours who fits this description to pop into your head.  OK, now proceed).

Figure 1 displays the “return” Investor C would have “enjoyed” over the past 34 years.1Figure 1 – Growth of $1,000 invested in KO stock only during “unfavorable” seasonal periods (December 1981-June 2015)

As you can see, late December into late January is not a “happy time” for KO shareholders.  For the record:

*This period was unchanged 1 time

*This period showed a gain 6 times (17.6% of the time)

*This period showed a loss 27 times (79.4% of the time)

*The average gain was +3.91%

*The average loss was -4.50%

So should KO shareholders consider selling their shares in late December and buying them back in late January?  Well, it’s a thought.

In Figure 2 we see the results for:

*Investor A bought KO stock in December 1981 and held it into June of 2015 (red line)

*Investor B held KO stock also but sold his shares at the close of December Trading Day 17 every year and then bought them back at the close of January Trading Day #20.  We will assume that an annual rate of 1% in interest is gained while out of KO stock (blue line).2Figure 2 – Growth of $1,000 using buy-and-hold (red) versus being out of KO stocks during “unfavorable” seasonal period each year (blue)

As you can see, the “flexible” trader – who simply sat out the same “late December to late January” period every year, came out far ahead of the “buy-and-hold” investor in this 34 year example.

For the record:

*$1,000 for the buy-and-hold investor gained +5,593% to $56,931

*$1,000 for the “flexible” investor gained +16,385% to $164,851

Summary

So should everyone be dumping their KO stock at the close on 12/23/2015?  That’s not up to me to decide.

Still, as far as trading strategies go – as a “South Side of Chicago” guy I used to know might say, “I seen woise.”

Jay Kaeppel

How to Put the Fizz Back in Coke (Part 3)

See Part 1 here and Part 2 here; See also “One Last Fizz Enhancer for Coca-Cola”

An Actual (Theoretical) Approach to Trading KO

So let’s assume two traders took the following approaches to trading KO starting on 12/31/1981, each with $1,000:

*Trader A bought $1,000 worth of KO stock and held it through 6/2/2015.

*Trader B bought and held KO stock twice a year, during the two favorable periods I have identified in Part 1 and Part 2 (March Trading Day 10 through June Trading Day 2 and October Trading Day 12 and November Trading Day 19).  We will further assume that Trader B used a margin account and bought KO stock using leverage of 2-to-1.  Finally, we will also assume that he earns 1% annually when out of KO stock and in cash.

Results

Starting with $1,000 between 12/31/1981 and 7/14/1998:

*Trader A saw his original $1,000 investment soar a stunning 6,007%, to $61,069 as KO stock went from $0.72 to $43.97 a share (also known as “The Good Old Days”).

*Trader B who held KO twice a year using margin saw his original $1,000 grow +2,068% to $21,676.  Not bad, but nowhere close to the buy-and-hold approach.  Since that time however, the table have turned dramatically.

Starting with $1,000 between 7/14/1998 and 6/2/2015:

*Trader A saw his original $1,000 investment decline by 6.8% to $932.

*Trader B who held KO twice a year using margin saw his original $1,000 grow +3,540% to $36,406.

So if we combine the two periods, starting with $1,000 between 12/31/1981 and 6/2/2015:

*Trader A saw his original $1,000 investment grow by +5,593% to $56,931.

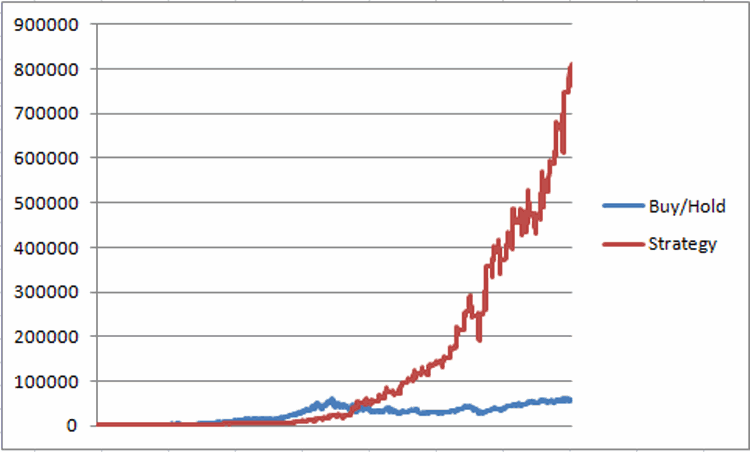
*Trader B who held KO twice a year using margin saw his original $1,000 grow +78,814% to $789,140.

The net results for  both traders appears in Figure 1.ko-1Figure 1 – Growth of $1,000 for Buy/Hold (blue) versus twice a year KO Seasonal Strategy; 12/31/1981-6/2/2015

For the record, these results do not deduct interest paid on margin debt, commissions or taxes.  Still, even if we made some deductions for these items, there would still be a wide disparity between “System Results” and “Buy and Hold Results.”

Annual Year-by-Year Results appear in Figure 2

Year Strategy Buy/Hold
1982 11.1 50.0
1983 21.5 2.8
1984 3.9 17.1
1985 65.2 35.4
1986 (6.0) 34.1
1987 (39.6) 0.8
1988 (7.8) 17.2
1989 86.2 73.1
1990 93.5 20.3
1991 34.0 72.6
1992 17.5 4.4
1993 (9.7) 6.5
1994 5.1 15.5
1995 28.8 44.1
1996 44.5 41.8
1997 41.5 26.7
1998 34.5 0.5
1999 62.7 (13.0)
2000 48.4 4.6
2001 8.0 (22.6)
2002 20.8 (7.0)
2003 41.3 15.8
2004 18.5 (18.0)
2005 17.6 (3.2)
2006 19.6 19.7
2007 49.0 27.1
2008 (2.7) (26.2)
2009 55.7 25.9
2010 10.1 15.4
2011 1.6 6.4
2012 8.1 3.6
2013 25.6 14.0
2014 27.0 2.2
Average 25.3 15.4

Figure 2 – Year-by-Year Results: Seasonal Strategy versus Buy-and-Hold

Summary

Buying on margin is in fact a “risky” strategy in that it exposes a trader to increased volatility of returns.  As such it is certainly “not for everyone.”  And of course, relying solely on seasonal trends is not something that the vast majority of traders are comfortable doing.  Finally, there is clearly no guarantee that “strategy” I have outlined will continue to work in the future. So if you choose not engage in this particular strategy I will raise no objections.

But the purpose of these articles is not really to convince you to pursue this given strategy or that given strategy.  The real purpose is:

a) To make you look at things differently than the average investor might

b) To help you learn to identify strategies that the vast majority of traders bypass

c) To point out that it is in fact possible to accumulate great wealth if you are willing to do the work necessary to:

  1. Identify a unique strategy
  2. Follow that strategy long enough to derive the expected benefit

Jay Kaeppel

How to Put the Fizz Back in Coke (Part 2)

In Part 1, I pointed out that it’s been tougher to make money with Coca Cola stock in the past 17 years (down x%) than it was during the previous 17 years (+7,586%?) – EXCEPT between the 10th trading day of March and the 2nd trading day of June.  This time out let’s look at another period that has been seasonally favorable for KO.

Bullish Trend #2: October Trading Day #12 through November Trading Day #19

This trend involves buying shares of KO at the close of the 12th trading day of October and selling at the close on the 19th trading day in November.  Figure 1 displays the growth of $1,000 invested only during this time period starting in 1982 through 2014.1Figure 1 – Growth of $1,000 invested in KO only between October Trading Day #12 and November Trading Day #19; 1982-2014

For the record:

*This period showed a gain 23 times

*This period showed a loss 10 times

*This period showed a gain 18 of the past 21 years

*The average gain was +7.2%

*The average loss was (-2.4%)

For 2015 this period will extend from the close on 10/16 through the close on 11/27.

The Year-by-Year results appear in Figure 2

Year %+(-)
1982 (0.0)
1983 0.9
1984 (1.5)
1985 18.2
1986 (6.6)
1987 (5.5)
1988 (1.5)
1989 16.1
1990 9.0
1991 11.1
1992 (0.0)
1993 (3.1)
1994 2.7
1995 6.3
1996 5.7
1997 6.0
1998 3.6
1999 30.5
2000 4.3
2001 5.0
2002 (2.1)
2003 3.3
2004 1.6
2005 2.4
2006 6.6
2007 9.1
2008 2.4
2009 4.0
2010 6.9
2011 (2.4)
2012 (0.9)
2013 5.8
2014 5.3
2015  ??

Figure 2 – Year-by-Year KO performance October Trading Day #12 through November Trading Day #19

Summary

Will KO show a gain between 10/16 and 11/27?  There is no way to know until after the fact.  But if you had to choose…………

Jay Kaeppel

What I Learned From George

I was reminded today that a guy I learned alot from – George Fontanills (one of the founders of Optionetics) passed away three years ago today.  What follows is a reprint of and article I wrote for Optionetics.com a few days later.

Kaeppel’s Corner: What I Learned from George

By Jay Kaeppel, Optionetics.com | Wed June 6, 2012 10:49AM PT (Copyright Optionetics Inc.)

The Optionetics community of staff, instructors and students is in mourning this week, following the loss of Optionetics “founding father” George Fontanills at the age of 52.

To those who knew him, George was larger than life. And the explanation for this is fairly simple.  There is something about encountering a person who you know is doing exactly what he should be doing with his life – and loving every minute of it – that is absolutely uplifting.  And that description fits George to a “T”.

I first met George at the first pre-OASIS meeting in May of 2004.  I didn’t know what to expect.  Turns out he was the most approachable and easy to talk to guy in the room.

My greatest memory of George was several years ago when we met in Atlanta to record six hours of video in two and half days for a course on futures trading.  I was going to cover three topics while he did color commentary and we would reverse roles for three other topics.

I have to admit I was a little nervous going in, for a couple of reasons.  First off, there was a voice in the back of my head that kept reminding me that if something went horribly wrong they weren’t going to fire George.  Also, since we would be doing commentary on each other’s topics, I thought it was important to communicate our material in advance to one another.  Nice try.

Every third day or so I would email George another updated set of Powerpoint slides so he could see what I was going to cover.  And with each new email I would remind George with an increasing sense of urgency that “I really needed to see his material” before we started.  I can’t recall his exact response but it was something along the lines of “I’m really busy right now, but we’ll get it all worked out in the end.”

Also, having not worked with George previously I didn’t really appreciate what a well of knowledge he was, and how he could simply summon it up whenever he needed to.

So when we met in the studio and I finally had the opportunity to pin him down face to face about what he was going to present, his only comment was “I kind of just do it.”  That was not exactly the answer I was looking for.  The first day of taping was kind of like a shortstop and a second baseman working together for the first time on perfecting the double play.  A couple of “drops” initially (the “voice” from the booth intoning, “Cut, OK let’s maybe try that part again”) but ultimately things started to flow.

I knew the material I was presenting pretty thoroughly and was on a bit of a roll the first time George chimed in.  It threw me off for a moment, but as his words rattled in my head I realized that he had offered an incredibly useful insight.  There were plenty more to follow.  I started to like it when he would jump in because I knew that the material was enhanced every time he did.  It all became more of a conversation than a lecture.

When it came my turn to do commentary on George’s topics, I was a little apprehensive at first.  I wondered how well he would react to my interrupting with some minor tidbit of information.  But there were two things I knew for sure – #1) I couldn’t just sit there like a potted plant and nod my head, and #2) the worst he could do was throw me out of the studio.  So at the first opportunity I jumped into the middle of George’s presentation.  The first words out of George’s mouth were “That’s an excellent point Jay”, as if it was something he meant to say but didn’t think of.   Now I am not sure if it really was an excellent point or not, but his reaction certainly put me at ease and immediately catapulted the interplay to a higher level.

The “double plays” came with more ease and frequency as we went.

On the third day we recorded the last hour in the morning.  During the final 15 minutes or so we basically just started bantering back and forth about trading.  It was glorious.  To put things into a little bit of perspective, know that I work at home and that my wife and kids long ago exceeded their ability to listen to me ramble on about the markets.  My only other option is to talk to the dog about trading.  And God bless her, when I do she’ll snap to attention and do that thing where she tilts her head a bit to one side and acts like she’s interested.  But it’s not quite  the same.

I can honestly say that those last 15 minutes of bantering with George about trading were 15 of the most enjoyable minutes I have spent in a very long time.  I clearly remember feeling a little sad when the “voice” said “That’s a wrap”, and how I wished that we could go on a little longer.

A few things I learned from George.

Go With the Trend

By the time I met George I had been in the business “a while” and had in fact spent 9 years as the Head Trader for a CTA trading primarily on a trend-following basis.  So it wasn’t like I was unaware of the concept.  But George had a way of simplifying things (even though in the meantime he was trading a spread with about 8 different legs).

One of the simple things he talked about a lot was the 10-30 moving average crossover.  If the 10 period moving average is above the 30 period moving average then be bullish and vice versa.  Not exactly rocket science, but the point was to focus on “the trend” and not “the noise”.  Different traders use a lot of different methods to time exact entries and exits, but one of the most important lessons George emphasized to all traders was to be aware of the underlying trend and to recognize that there was more money to be made trading with the trend than against it.

Specialization

Another thing that George always recommended was to “specialize.”  In other words, if you find you have a knack for trading crude oil then focus on trading crude oil.  If you were good at trading butterfly spreads then focus on trading butterfly spreads.  This is such simple advice, and yet not necessarily something that is easy to do.  With so many markets and so many trading vehicles available today it is harder than ever to force oneself to specialize as George suggested.

But the idea of “getting very good” at something and then “doing that” is a nugget that all traders should drink in and let rattle around the brain for a while.

Adjusting Positions

Although I had traded a lot of options prior to joining Optionetics in 2004, my background was primarily that of a futures trader and so I approached option trading with the same, “find a trade, get in, and then either take your profit or cut your loss but just get the hell out” mentality.  The idea of “adjusting” an option position was a fairly foreign concept to me.

The first time I heard George explain an example of adjusting one option position into another position, I have to admit, the specifics of it went completely over my head.  But I got the significance of the concept and what he was really teaching – that there are any number of possibilities if you are willing to do the work necessary to explore them and find a way to “lock in a profit” and let the rest of the new adjusted position “ride.”

The ability to open people’s minds to new ways of thinking was one of George’s greatest talents.

The Out-of-the-Money Butterfly

George loved the butterfly spread.  But it took me a while to learn that he was not talking about your generic, run-of-the-mill, at-the-money neutral butterfly where you put it on and you hope to heck the underlying security doesn’t go anywhere and that you can hold on until expiration and make a lot of money.  He was generally looking at something cheap, out-of-the-money and in a ratio of something other than 1 x 2 x 1.  These positions shared a couple of common traits, 1) they were cheap, and 2) they had explosive upside potential if the underlying stock or commodity moved within a particular range, and 3) they could easily be adjusted into “some other position.”

Powerful stuff that most traders never consider.

 His Ultimate Purpose as an Educator

George often stated that his job (and our job as Optionetics educators) was to help get people “up the learning curve” as quickly as possible.  I’m not sure how much people really appreciate the importance and value of this.  So let’s not understate this.  People who paid attention to what George told them about trading stood to literally save themselves years of “floundering” and “trial and error” (not to mention unnecessary trading losses) that many of us “old timers” spent in trying to learn how to trade.  Stop for a moment and consider the value of that.

As George would say, “If I can teach someone in two days what it took me seven years to learn, that’s a pretty good thing.”  A pretty good thing indeed.

All of this just pretty much scratches the surface.  So one last time let me just say, “Thanks for everything George”.

I will miss you.

Jay Kaeppel

How to Put the Fizz Back in Coke (Part 1)

Please see also What I Learned from George

As the world’s leading purveyor of sugar laden drinks (and coincidentally also the purveyor of one of the most effective products in the world for cleaning up at a crime scene, but I digress), Coca-Cola is under attack these days.

The next sentence usually starts with the phrase “As Americans become more health conscious…….yada yada”.  Har.  What it should say is something more like “as America comes to grips with the fact that it can’t get itself off of its collective couch, it actively seeks to blame someone other than itself by scapegoating the companies who produce the products that they can’t bring themselves to stop consuming.  For example, I believe that if only that Dairy Queen near my house didn’t exist I would be a picture of health! (Never mind that I go into serious withdrawal when the store closes for the winter months).

Anyway, my point is that it’s tougher to make money in KO than it used to be.  In Figure 1 you see a chart for KO going back to 1975.  After hitting an adjusted low of $0.56 a share in 1981 the stock then advanced to $44.47 by July of 1998.  That’s a gain of 7,859% for those keeping score at home.  Over the past 17 years the stock has gone, essentially nowhere.  After hitting lows under $19 a share in 2003 and 2009 the stock finally rallied to a new all-time high in October and November of last year.  And I hope you enjoyed it because the stock is now back around $40 a share.1Figure 1 – KO: A Tale of Two 17-Year Periods

So like I said, KO isn’t quite the “sure thing” it used to be.  Or is it?  Now granted there are no “sure thing” ways of trading anything.  But there are some that can be pretty darned consistent regardless of what is going on in the market.  Let’s take a closer look at KO stock.

Seasonal Trends in KO

Bullish Trend #1: March Trading Day #10 through June Trading Day #2

This trend involves buying shares of KO at the close of the 10th trading day of March and selling at the close on the 2nd trading day in June.  Figure 2 displays the growth of $1,000 invested only during this time period starting in 1982 through 2015.2Figure 2 – Growth of $1,000 invested in KO only between March Trading Day #10 and June Trading Day #2; 1982-2015

For the record:

*This period showed a gain 26 times

*This period showed a loss 8 times

*The average gain was +10.1%

*The average loss was (-2.2%)

The Year-by-Year results appear in Figure 3

Year %+(-)
1982 6.2
1983 9.6
1984 3.6
1985 9.0
1986 4.8
1987 (9.2)
1988 (1.6)
1989 18.2
1990 28.5
1991 4.9
1992 8.8
1993 (1.5)
1994 (0.0)
1995 7.0
1996 14.1
1997 14.1
1998 12.8
1999 (1.2)
2000 21.2
2001 (0.2)
2002 12.8
2003 15.6
2004 7.2
2005 5.8
2006 2.5
2007 11.9
2008 (1.9)
2009 20.5
2010 (1.8)
2011 3.3
2012 4.9
2013 6.2
2014 7.1
2015 2.6

Figure 3 – Year-by-Year KO performance March Trading Day #10 through June Trading Day #2

Summary

Now your first reaction might be to say “Gee, thanks Jay for telling me about this trend the day AFTER it is over for this year.”  OK, not exactly timely reporting on my part.  But, hey, there’s always next year (Take it from me, I’m a Cubs fan).  And the year after that.  In Part 2 I will highlight another seasonally favorable period that you might still be able to take advantage if this year.

Jay Kaeppel

An Interesting Approach to Trading – That Most Traders Never Consider

Follow @jaykaeppel

One of the most important jobs of any trader is to figure out what strategy or strategies works for them.  Just because someone tells you they are making money using a particular strategy does not mean that you will necessarily enjoy the same success as them if you try to use the same strategy.

See A Short Course on Ratio Spreads (from two Experts)

Everyone has different temperaments, risk tolerance levels, etc.  So another important job for any trader is to figure out – or perhaps I should say filter out – strategies that that they are not comfortable using, no matter how good they may look or sound.

Still, if you look at trading as an art form (Important Note: if you look at someone else’s trading strategy as an art form that’s OK.  If you start looking at your own trading approach as an art form – um, you might want to take some time off, because I think a serious and unexpected drawdown is lurking in the very near future), it is OK to look admiringly upon strategies that you personally do not use.

Let me give you an example.  Michael Gross and James Cordier (www.OptionSellers.com) have been in the business of selling out-of-the-money futures options (and other similar strategies) for a very long time (at least since 1999).  Their book, “The Complete Guide to Option Selling” is now in its third edition.  A few relevant notes:

*The gist of what they do (and/or advise others about doing) is selling way far out of the money options on various futures contracts, collecting premium and then wait for the options to decline in value due to the passage of time and the lack of a hugely adverse move.

*Rather than relying solely technical analysis and/or option Greeks, Gross and Cordier also incorporate a great deal of fundamental analysis – in other words, they consider the supply and demand situation for the market in question to essentially get an idea of what is least likely to happen.  In other words, if a bumper crop of corn (and thus lower corn prices) is anticipated they might advise selling far out-of-the-money call options.  Likewise, if bad weather during planting season is expected to create a shortage (and thus higher corn prices) then they might suggest selling far out of the money put options.

*Now here is where it gets interesting: I personally do not sell out-of-the-money futures options.  For a variety of reasons I have determined that this strategy is “not my thing.”  Despite this I still read every missive I get from Gross and Cordier with great interest.  And I usually learn something too.  At times I find their ideas so compelling I think about “changing my spots” so to speak.  But to date I remain haunted by this simple truth (for me) – “I’m and old dog and these are new tricks.”

The Bottom Line

If you are a futures options trader – or have ever considered doing so – or if you are looking for an approach to option trading that is different than the standard “hey, I am bullish so I am going to buy a call option”, these guys are worth a look.

To see one (impressive) example of their analysis click here

To buy their book or learn more about it click here

To get all the information visit: www.OptionSellers.com

OK, here’s the weird part.  For the record I am not endorsing their service as I have never used it (although, also for the record – I have read their book cover to cover more than once).  I am merely highlighting a source of consistently very useful, interesting and enlightening information that I have enjoyed reading for many years.

If you are into options, futures, fundamental analysis of commodity markets, or if you are just sick of reading the same old stuff, I believe you may find it interesting also.

Jay Kaeppel